Gilgit-Baltistan Glaciers & Water 2000–2026
What satellites measure about Gilgit-Baltistan's glaciers, snow and stored water: how fast the ice is going, what is driving it, and what that means for water downstream. Every figure comes from a named sensor and has been tested.
Findings
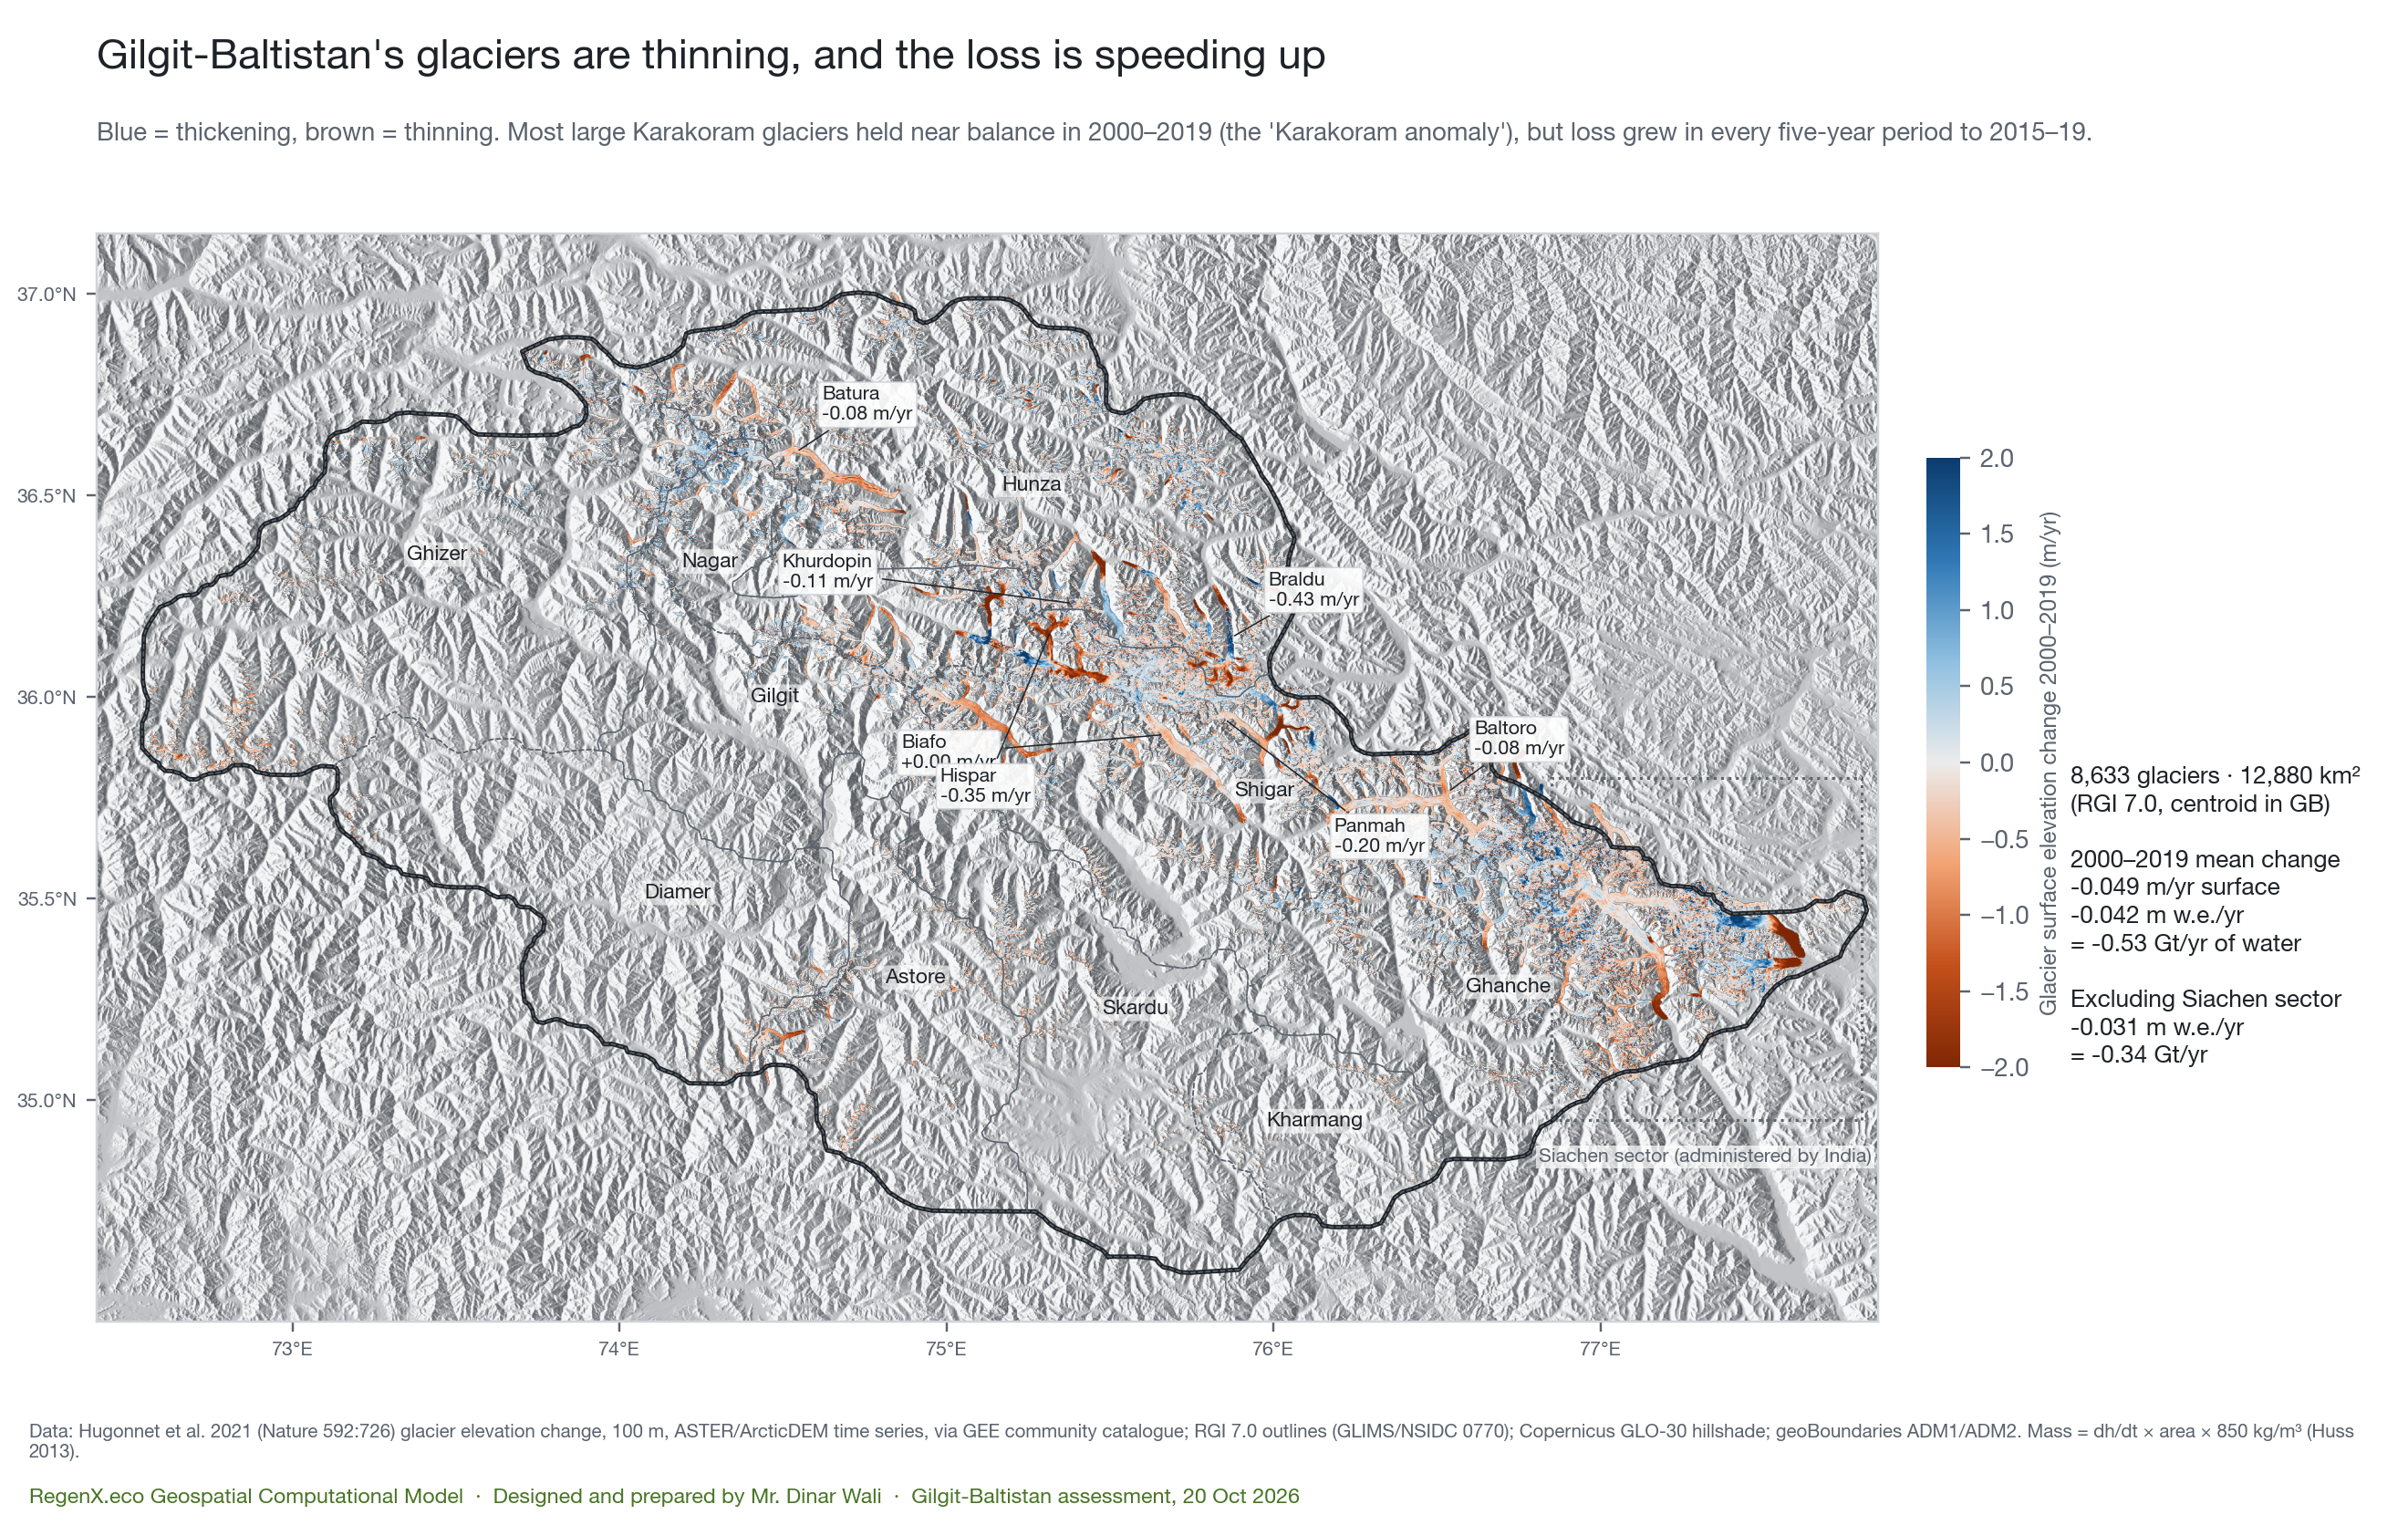
- MeasuredGilgit-Baltistan holds 8,633 glaciers covering 12,880 km² (RGI 7.0, centre inside the GB polygon). That includes 2,142 km² in the Siachen sector, which India administers. Without that sector it is 10,738 km².
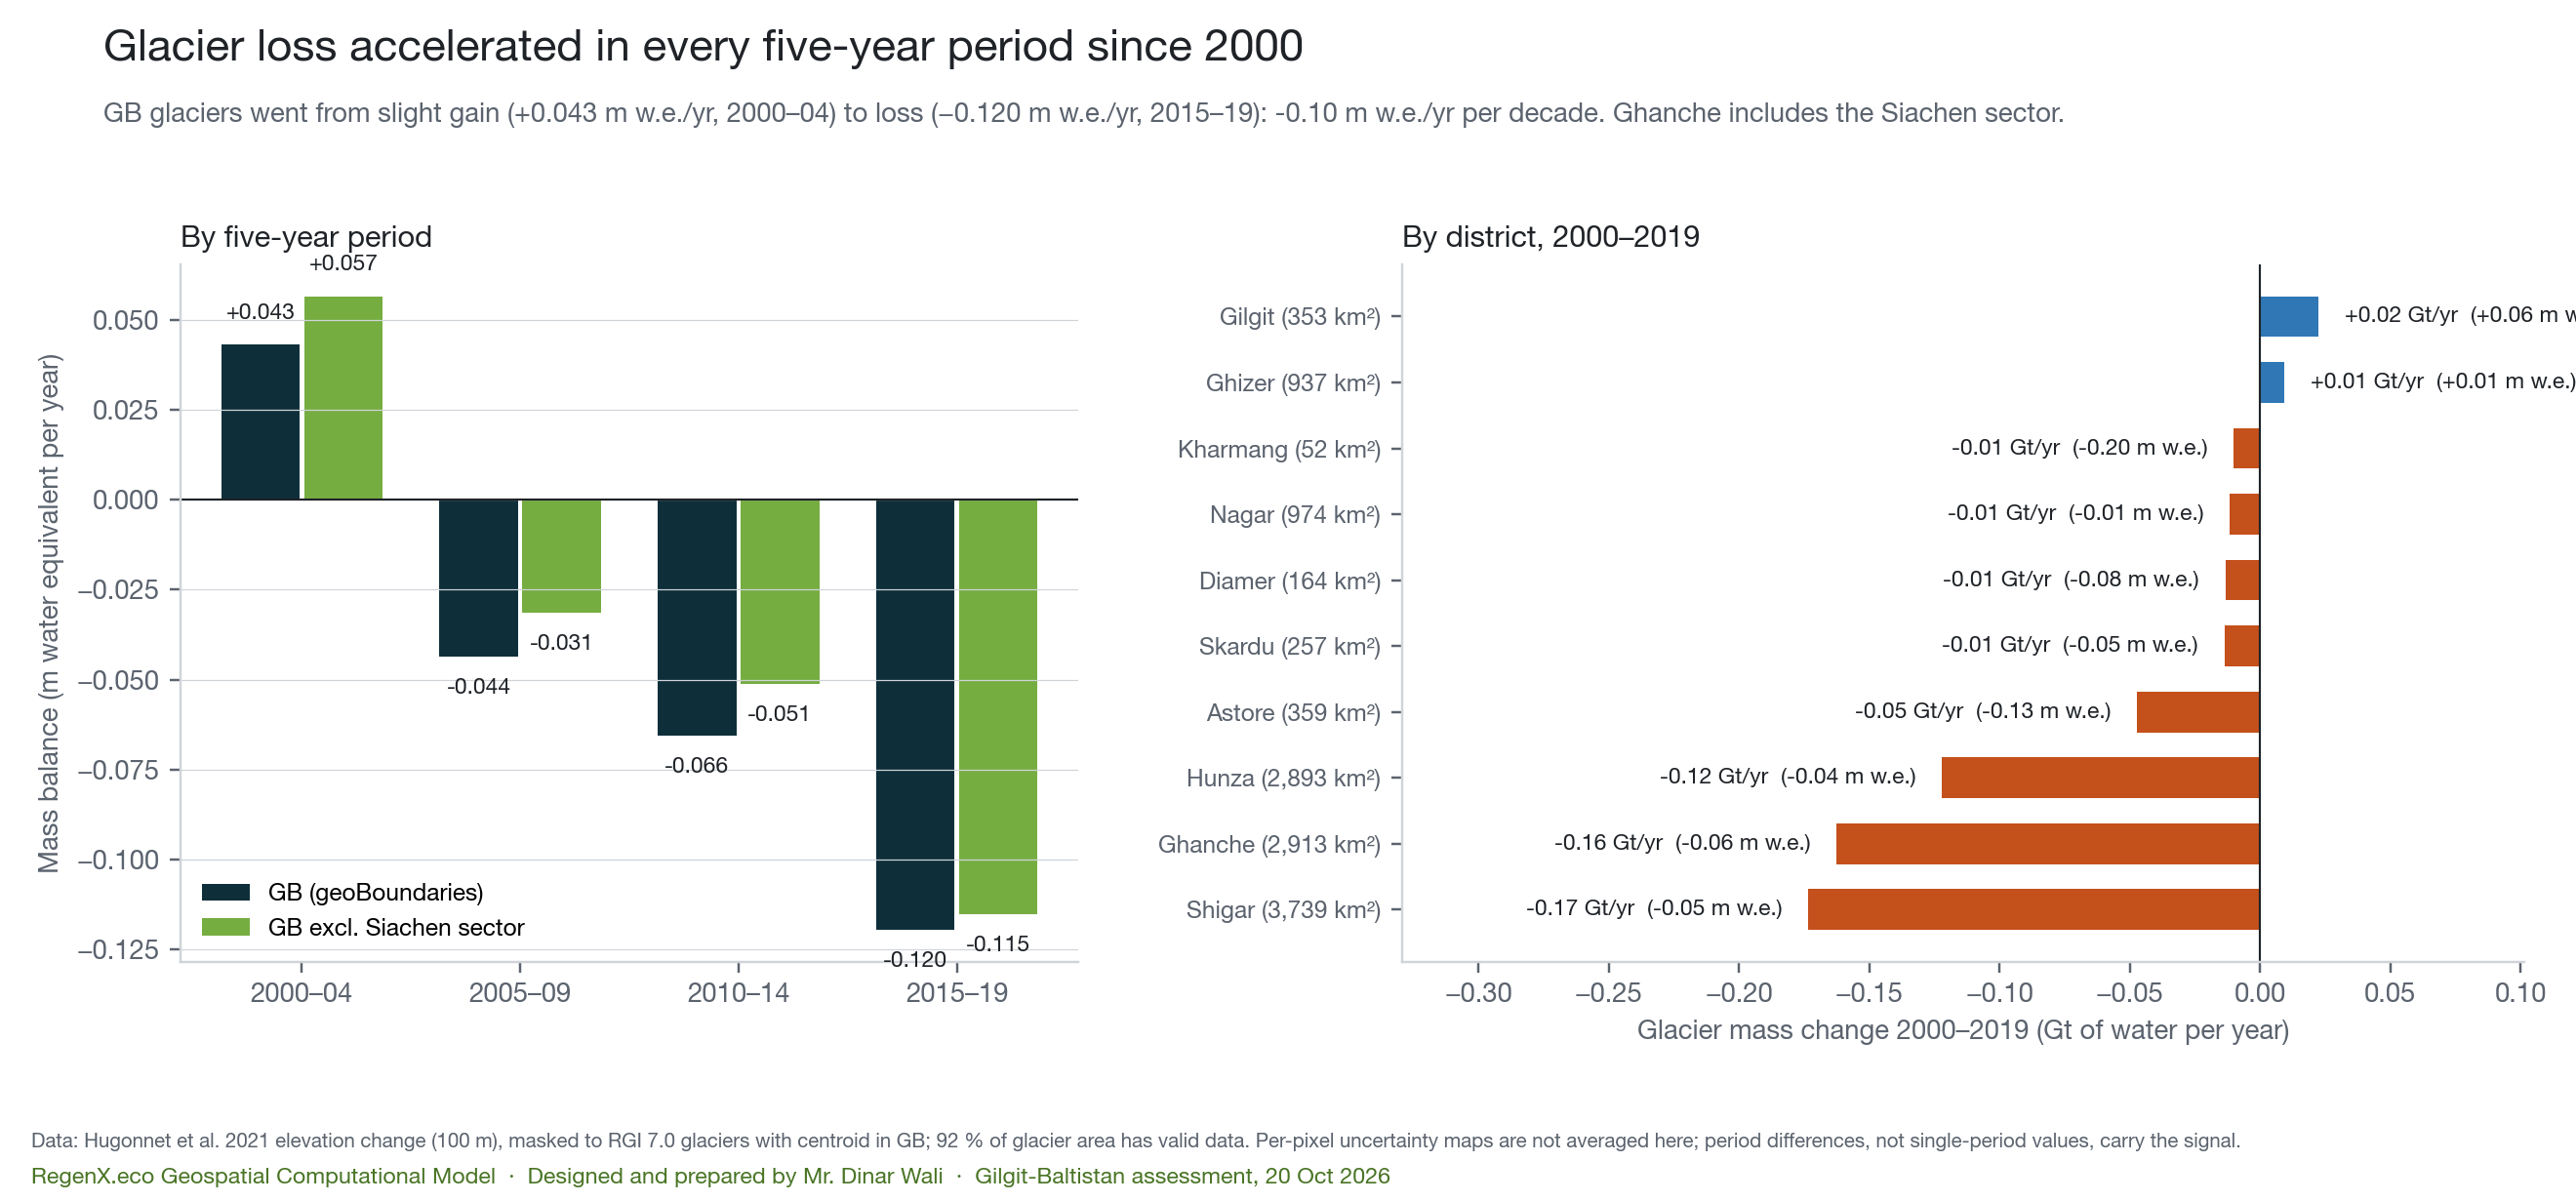
- MeasuredGlacier loss has accelerated in every five-year period since 2000. GB glaciers went from a slight gain of +0.043 m water equivalent per year (2000–04) to a loss of −0.120 m w.e./yr (2015–19). That is −1.5 Gt of water a year by 2015–19, against −0.53 Gt/yr averaged over 2000–2019. Excluding the Siachen sector the pattern is the same: +0.057 to −0.115 m w.e./yr.
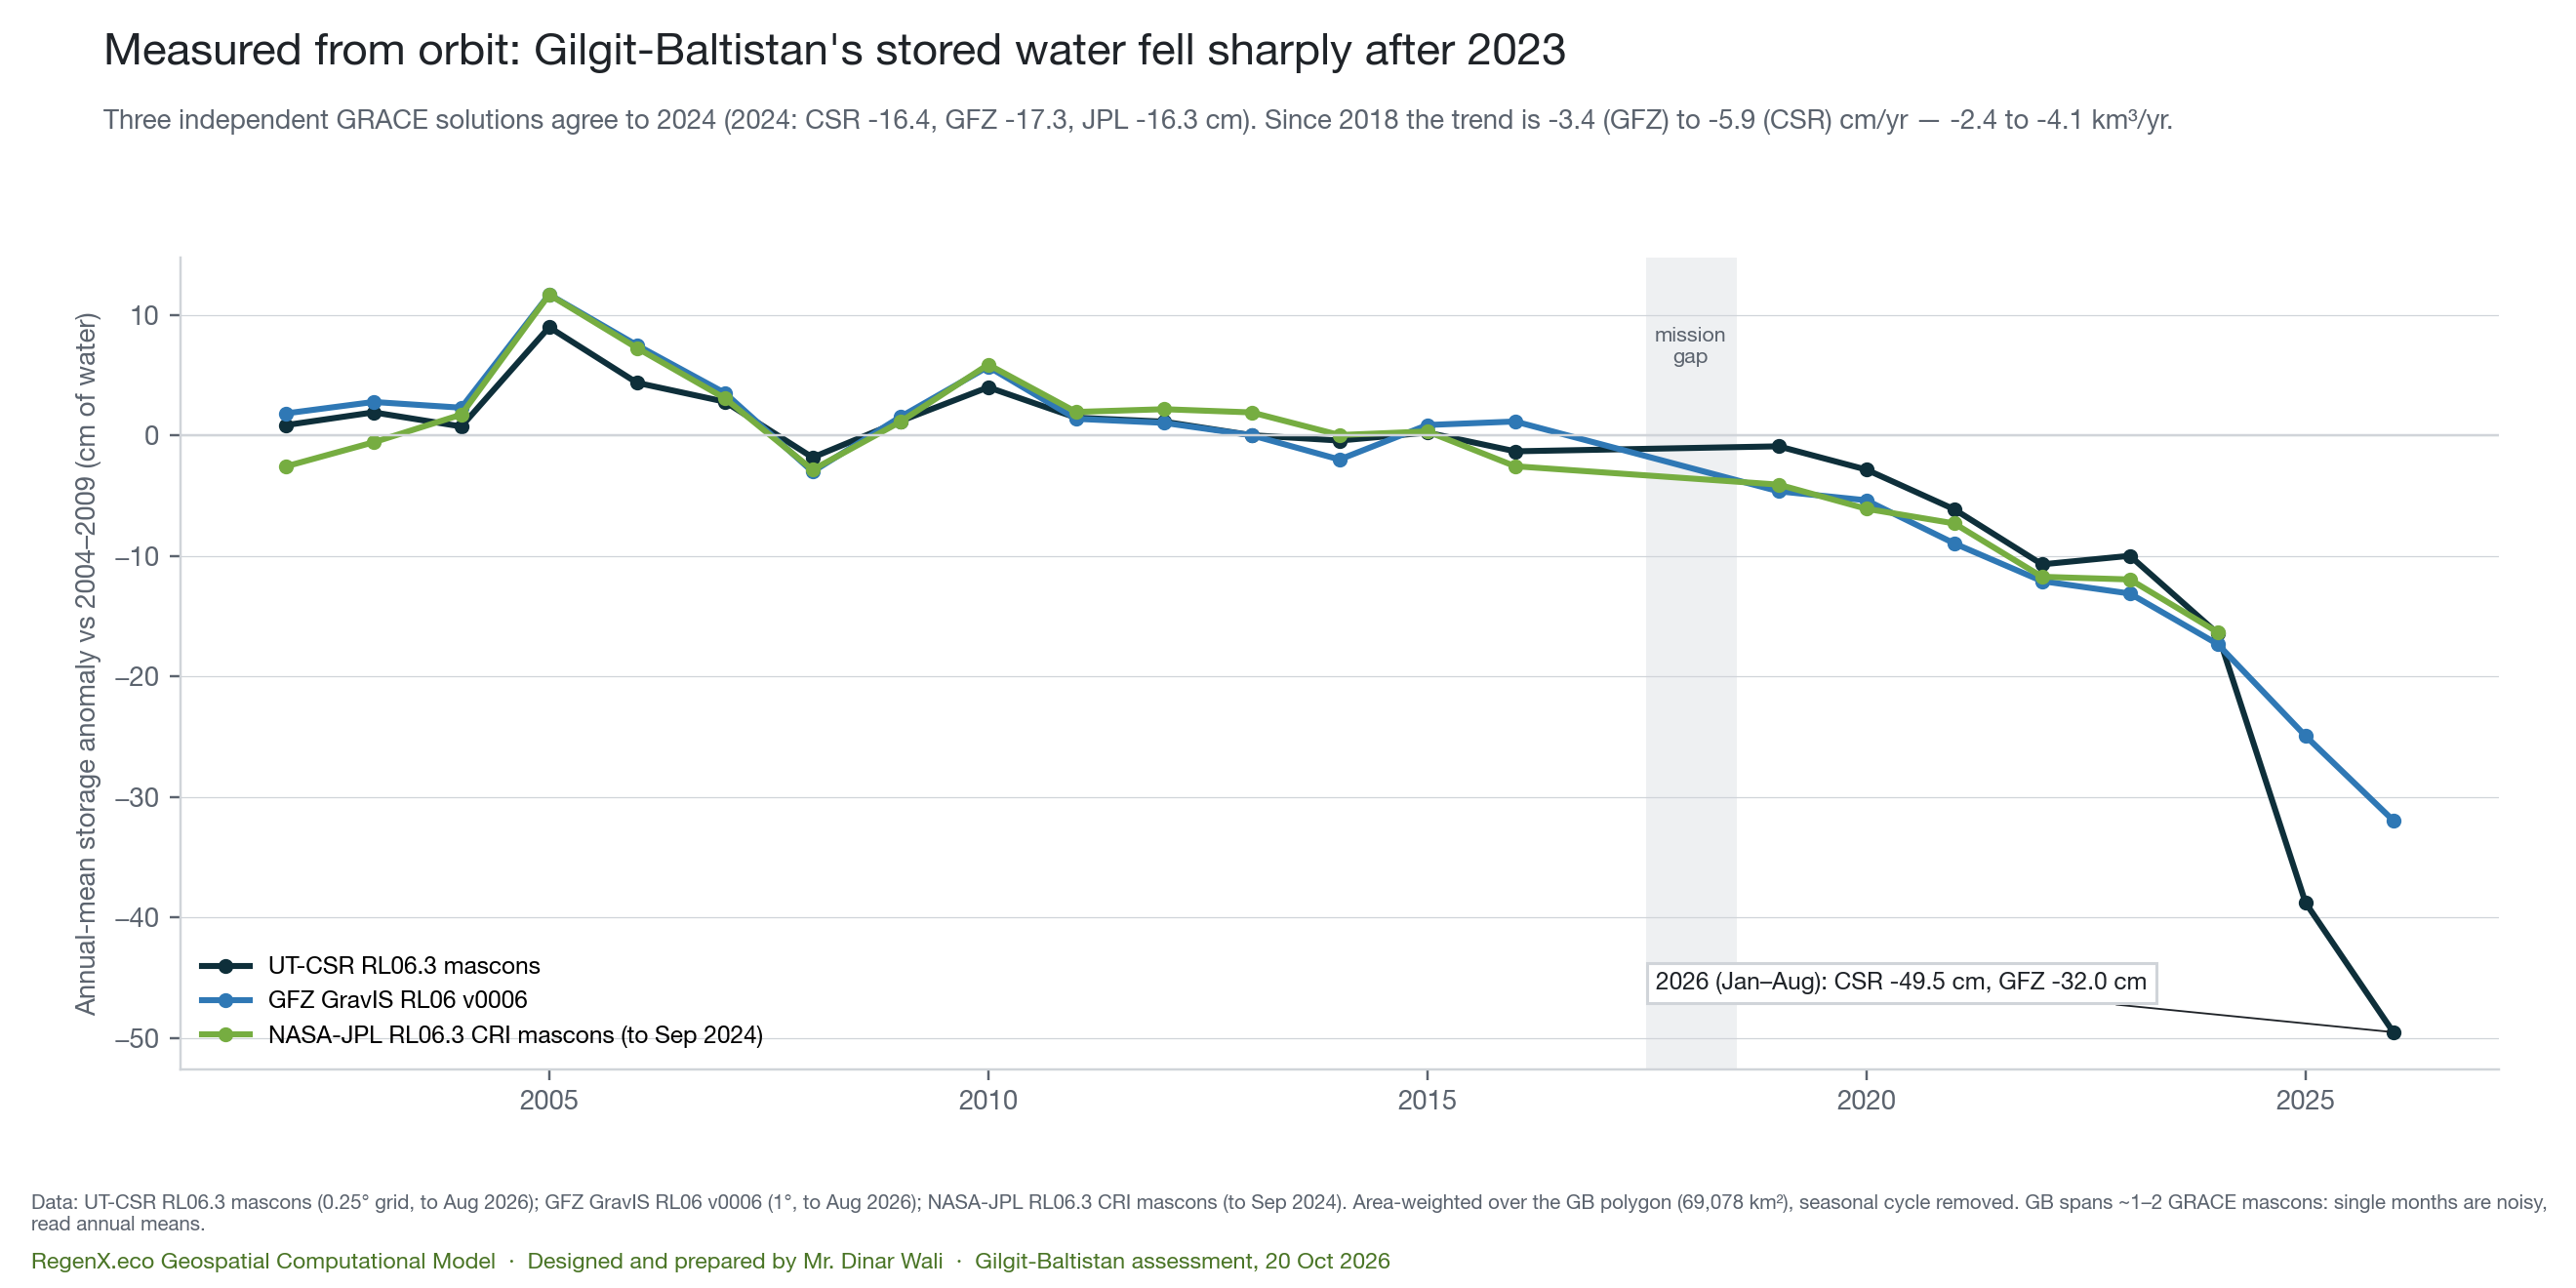
- MeasuredGB's total stored water fell sharply after 2023. Three independent GRACE solutions agree to 2024: CSR −16.4, GFZ −17.3 and JPL −16.3 cm against 2004–09. Since 2018 the trend is −3.4 to −5.9 cm/yr (GFZ to CSR), or −2.4 to −4.1 km³ a year. The 2026 anomaly (Jan–Aug) is −32 to −50 cm; the two solutions agree on direction but not on size.
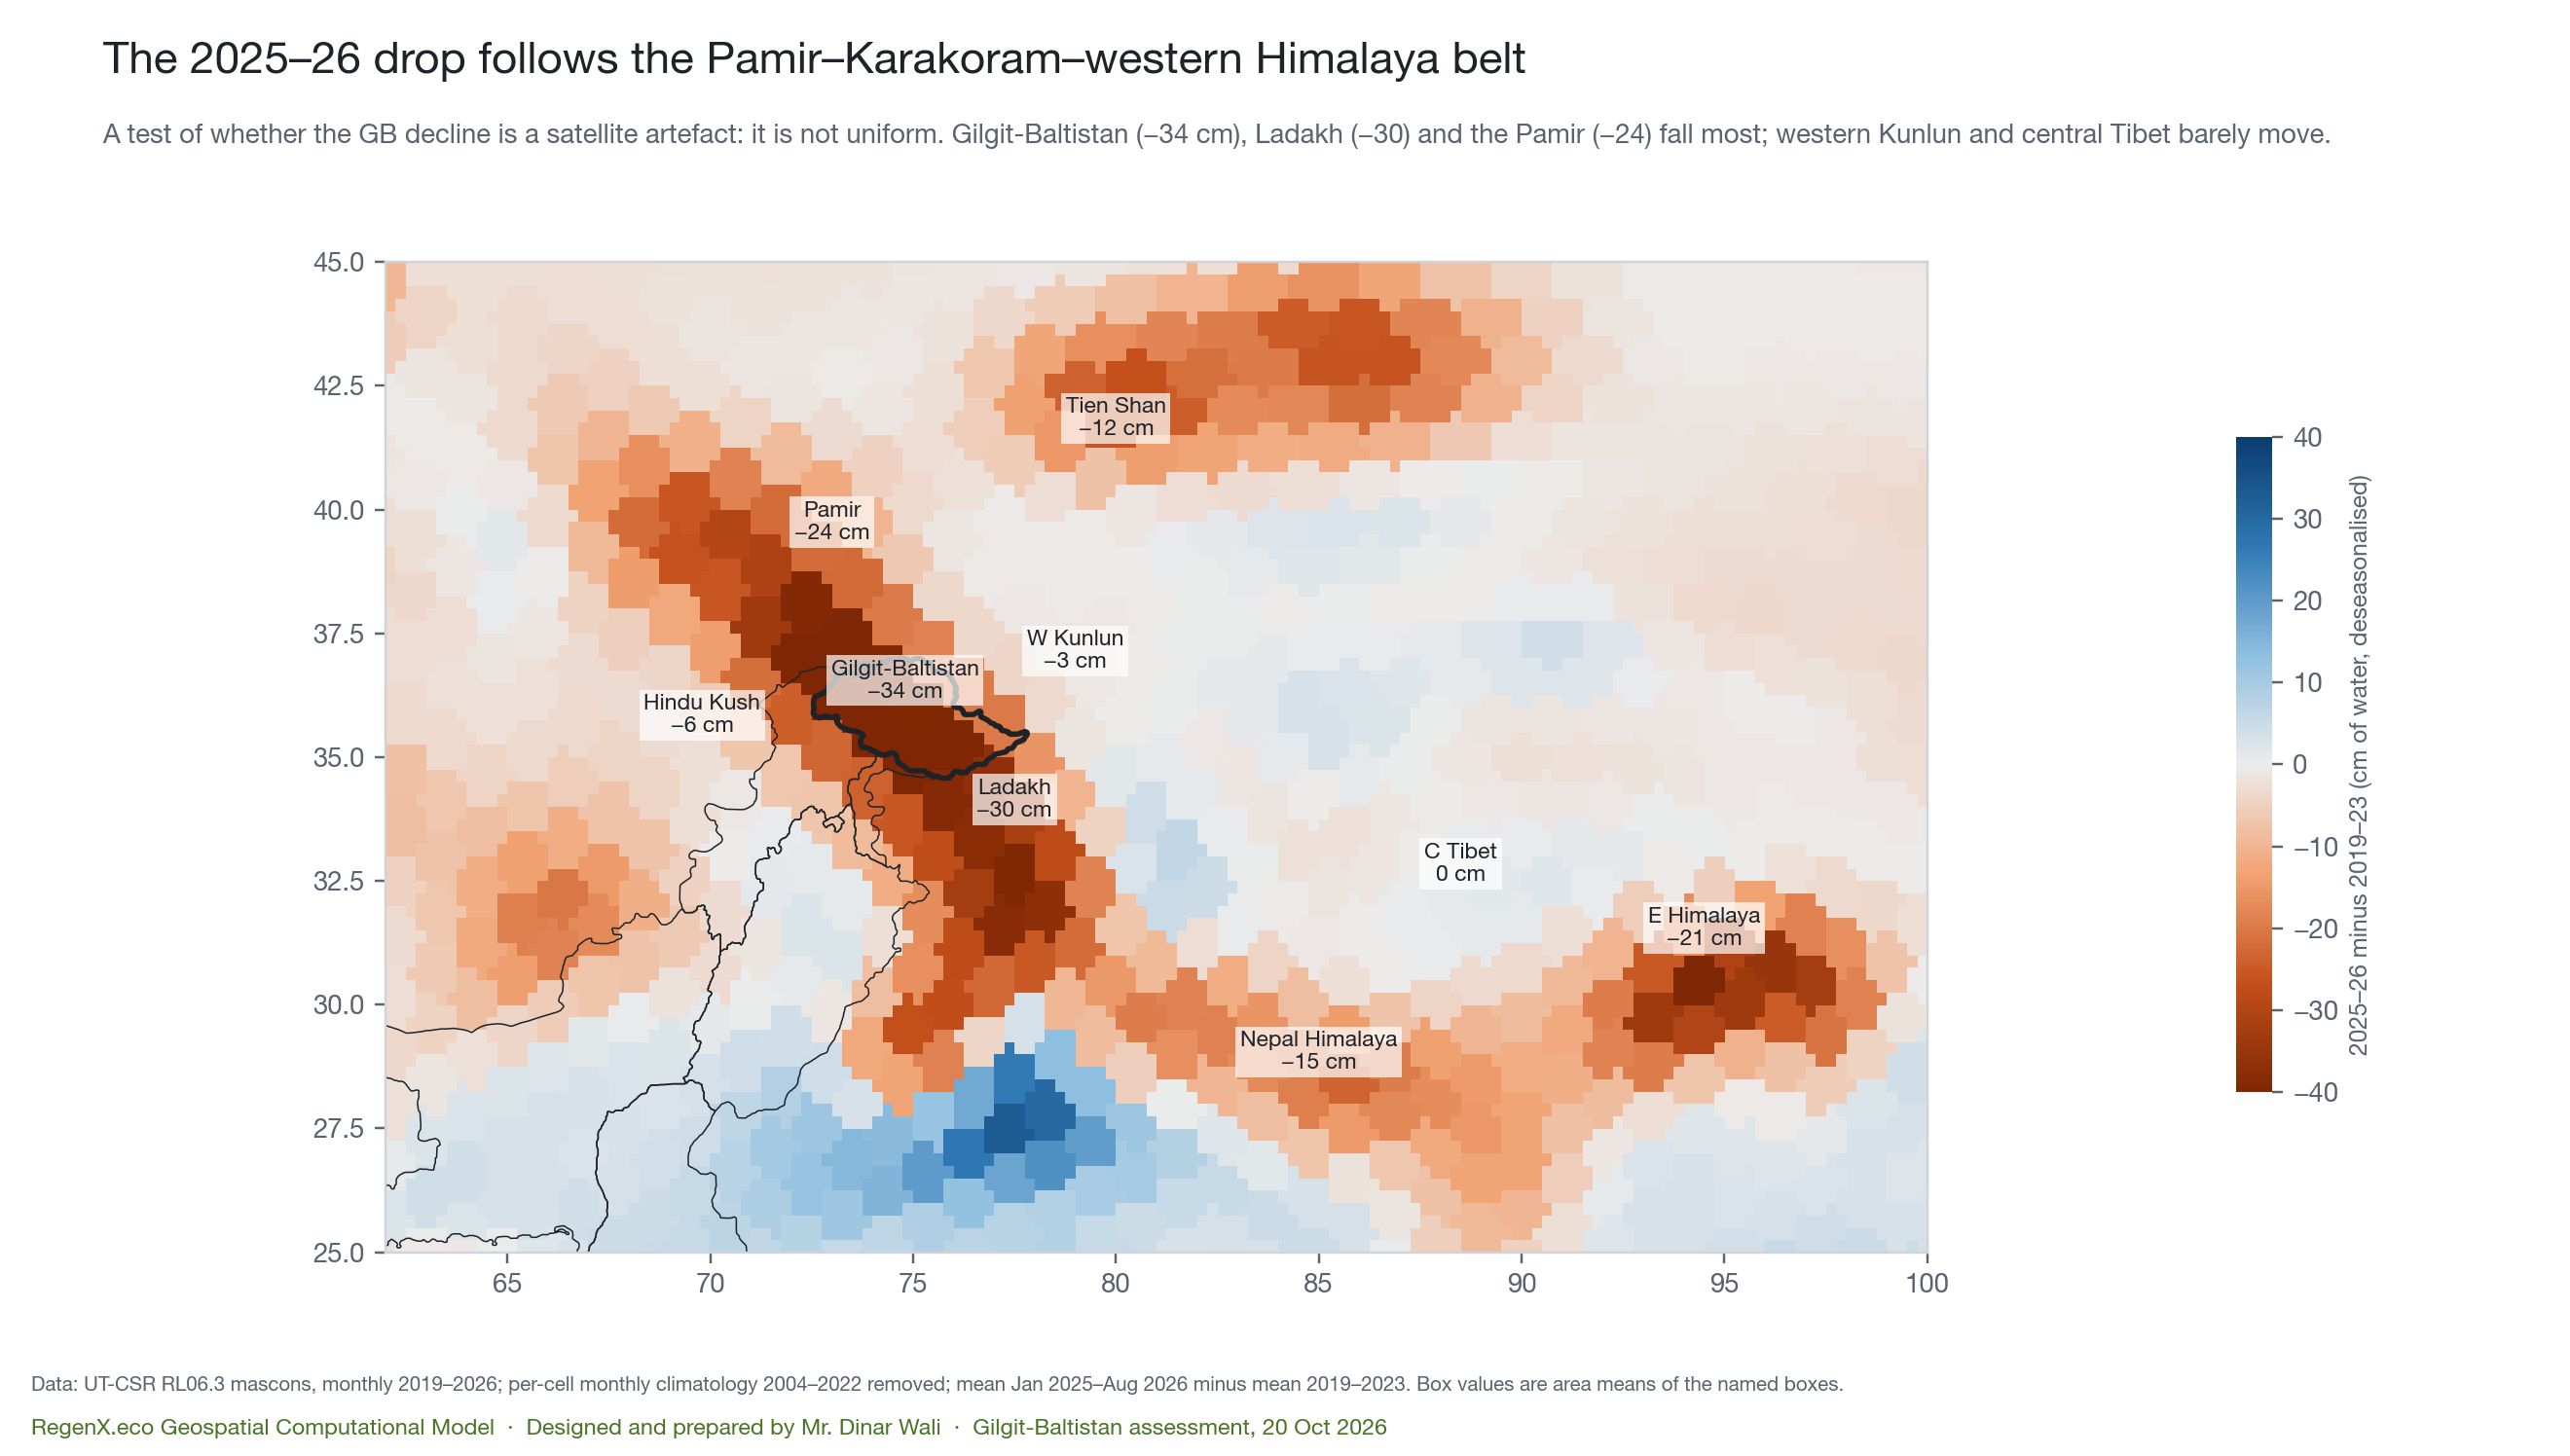
- MeasuredThe drop is regional, not a satellite artefact. Relative to 2019–23, storage fell 34 cm in GB, 30 cm in Ladakh and 24 cm in the Pamir. Western Kunlun (−3 cm) and central Tibet (0 cm) barely moved.
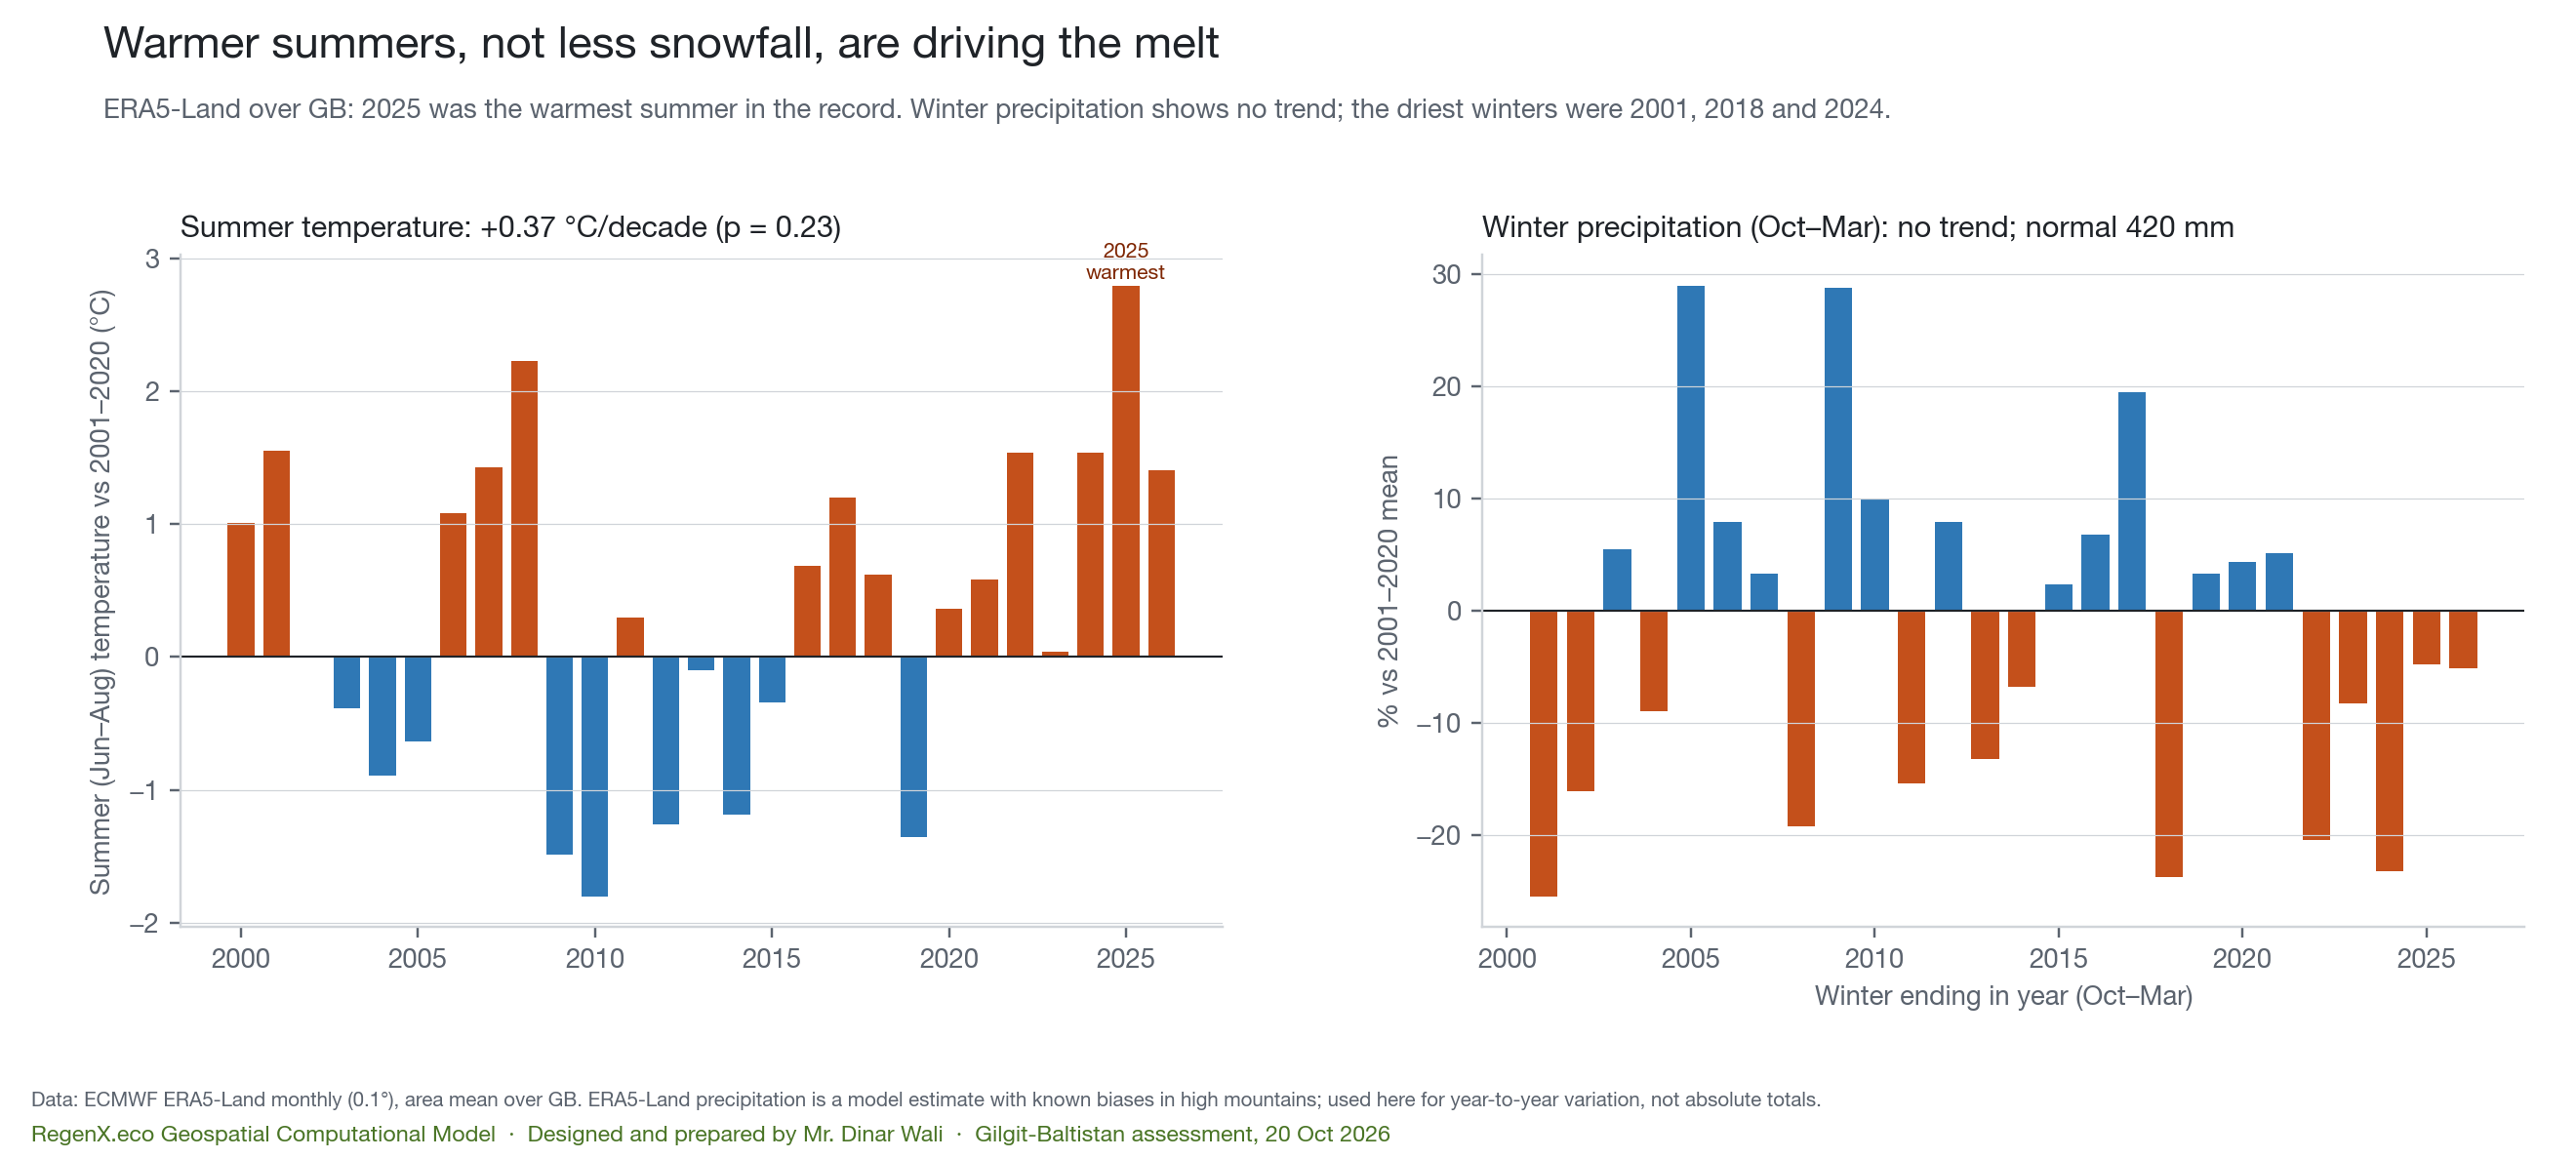
- MeasuredHeat, not missing snowfall, is the driver. Summer 2025 was +2.8 °C above the 2001–20 mean, the warmest on record, and 2026 was +1.4 °C. Winter precipitation in 2025 and 2026 was near normal (−5 %). Across 26 years, warmer summers go with barer glaciers each August (r = −0.79, p ≈ 10⁻⁶).
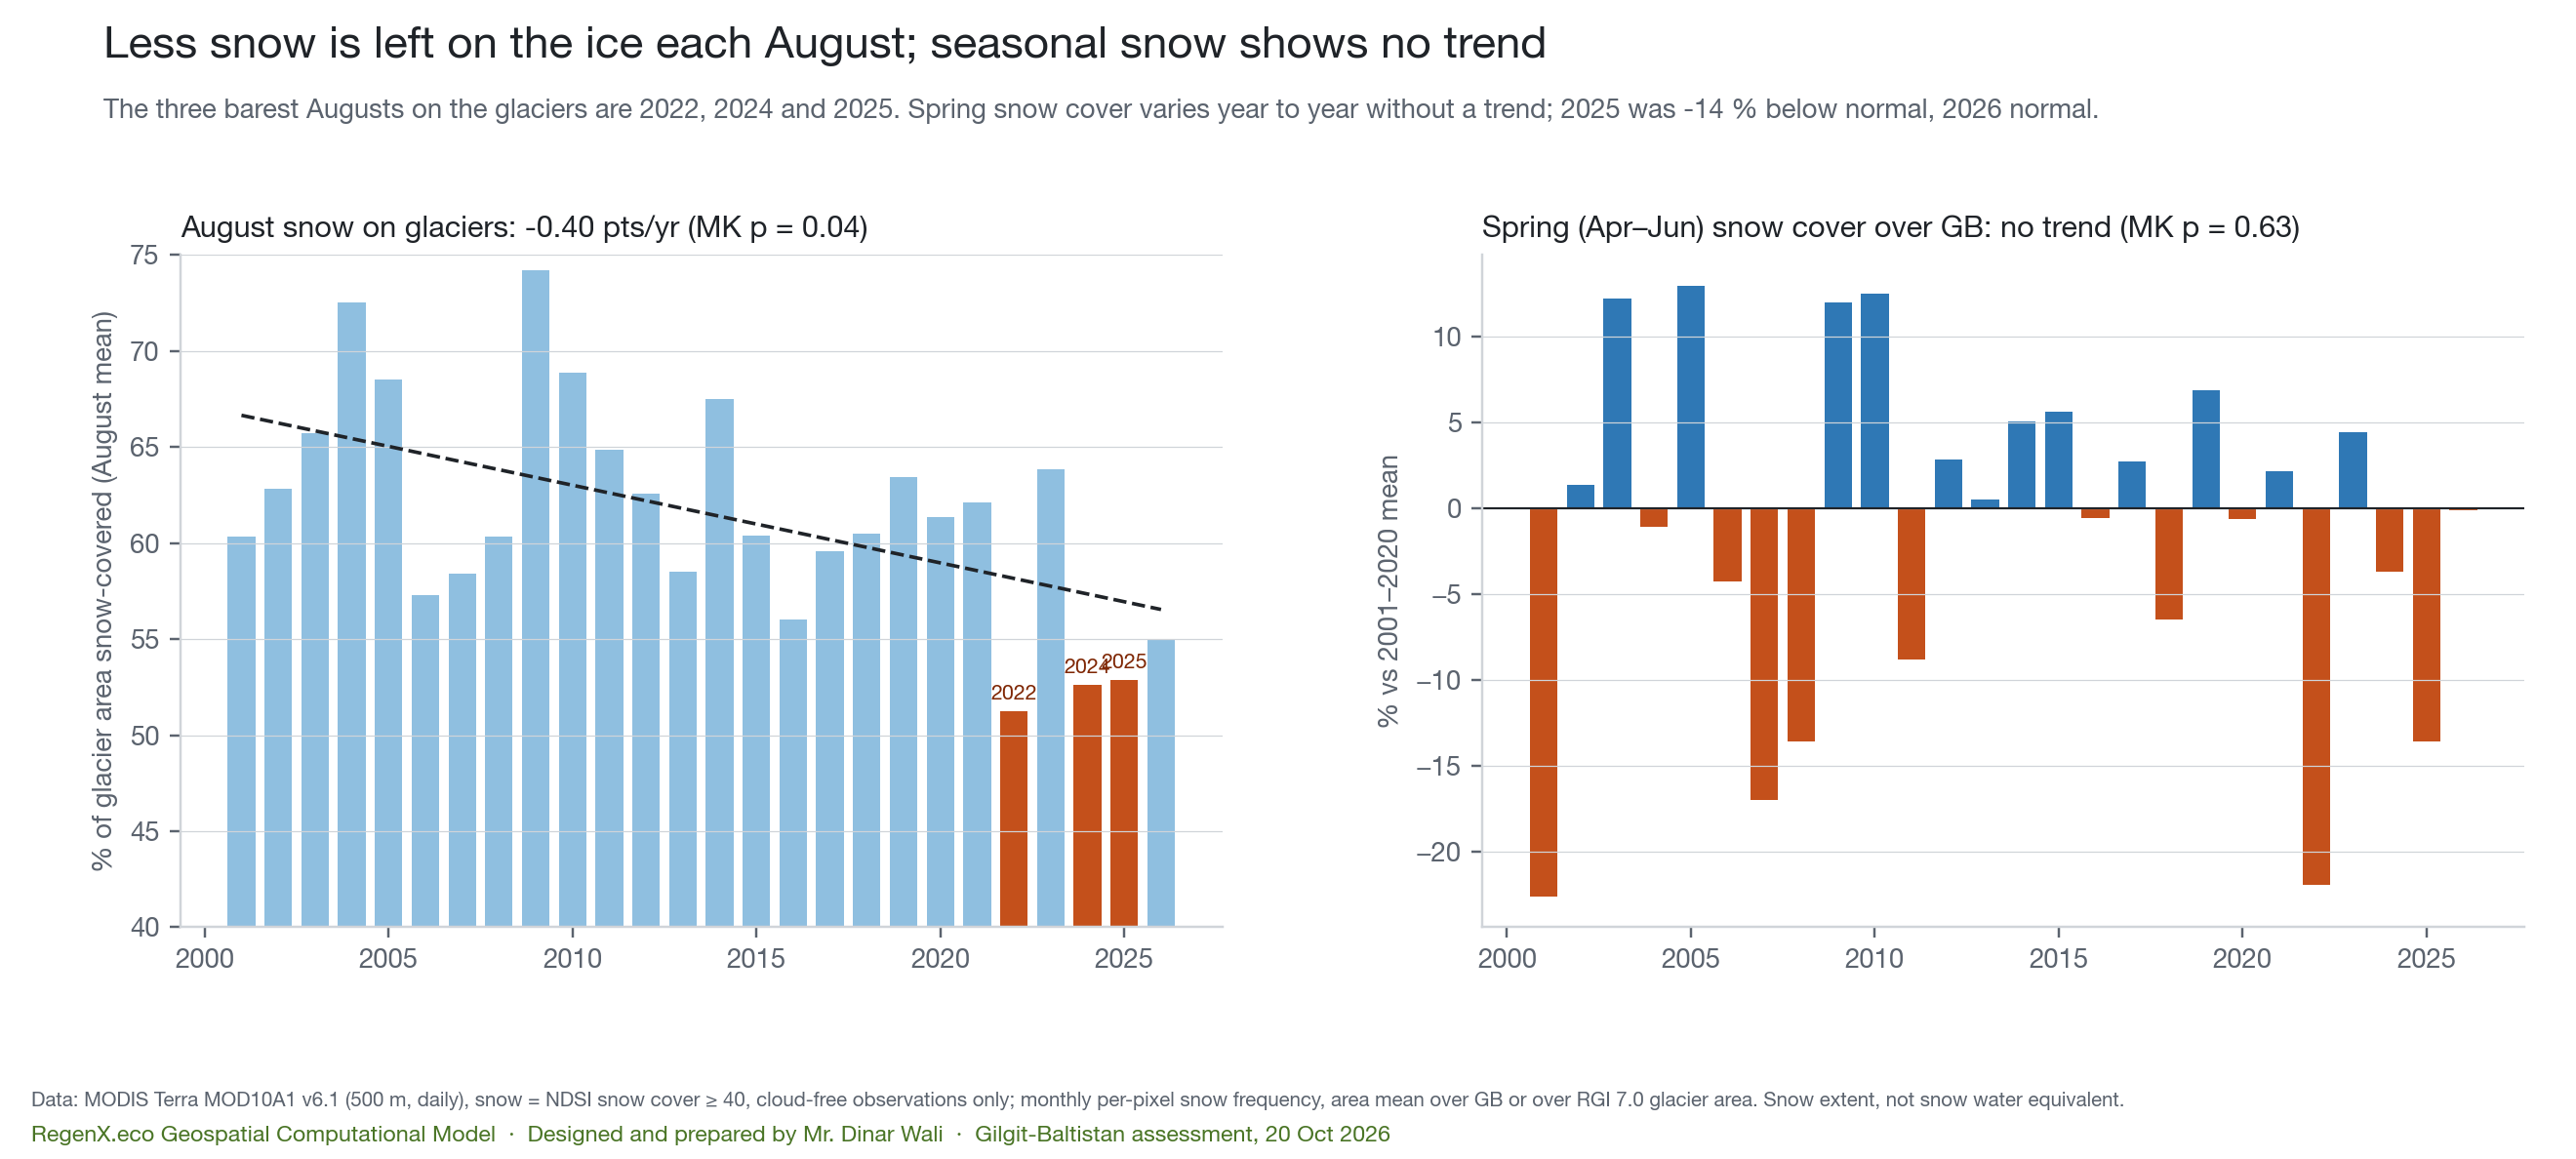
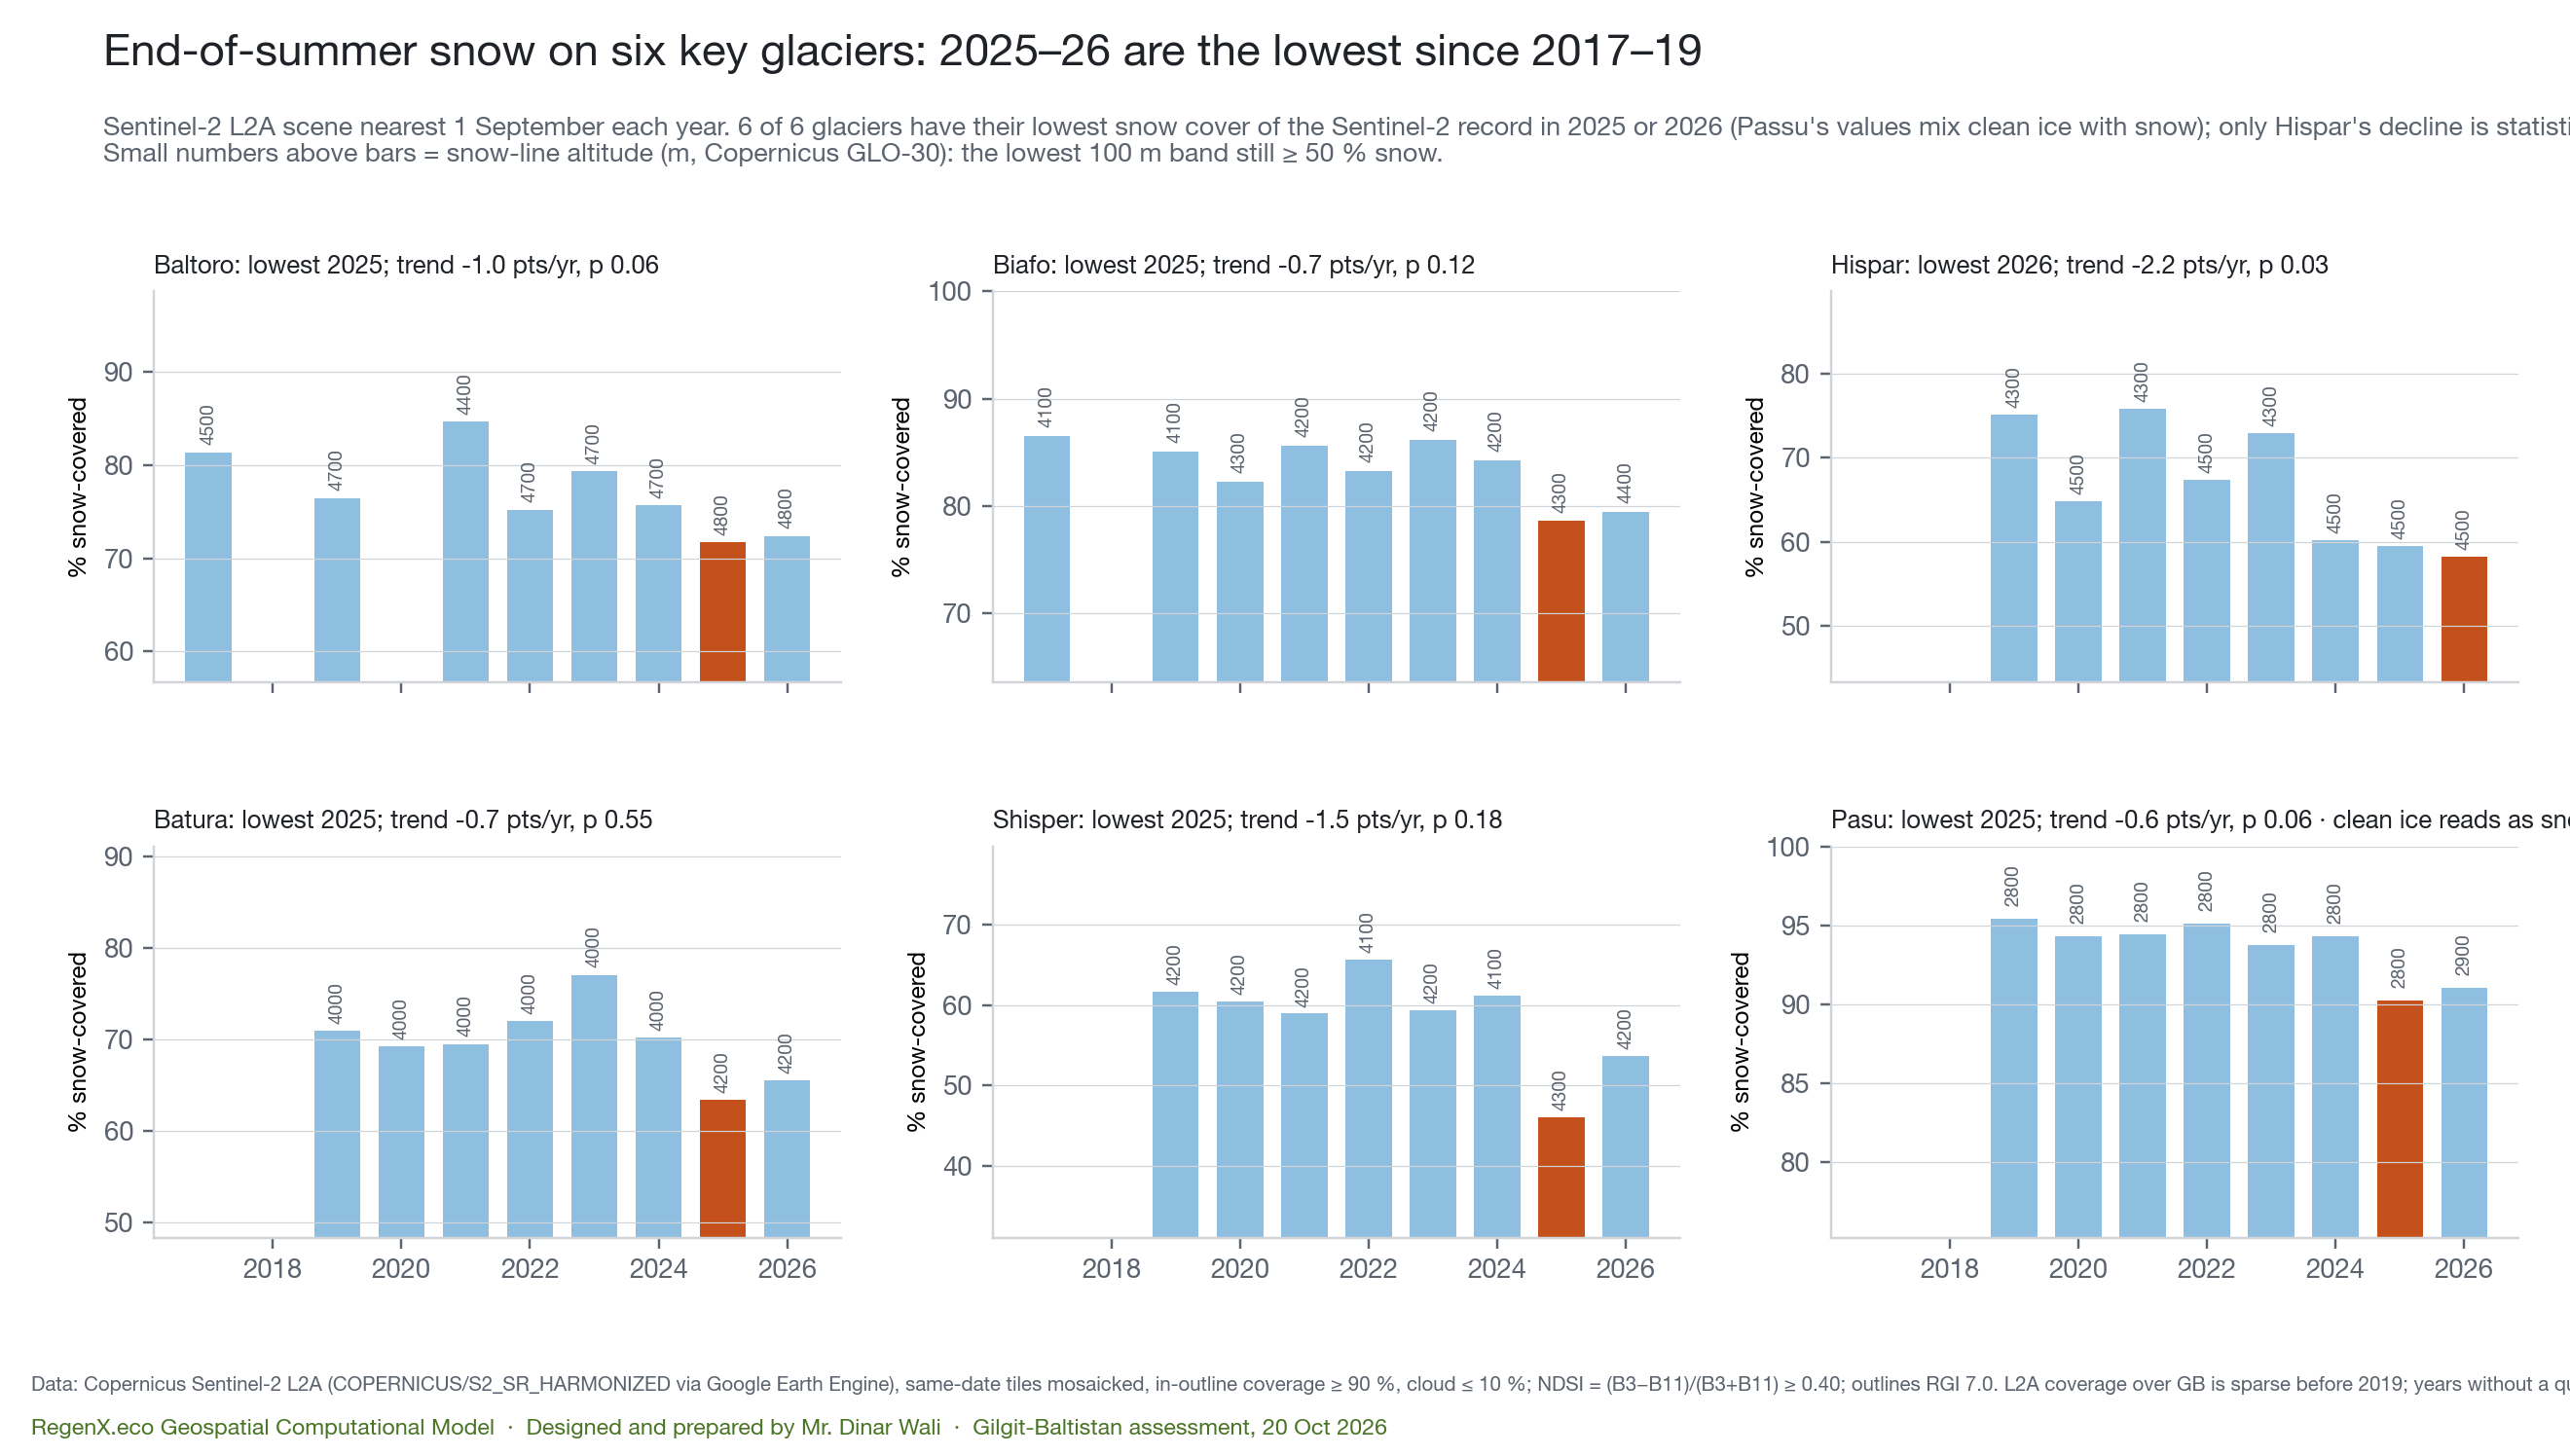
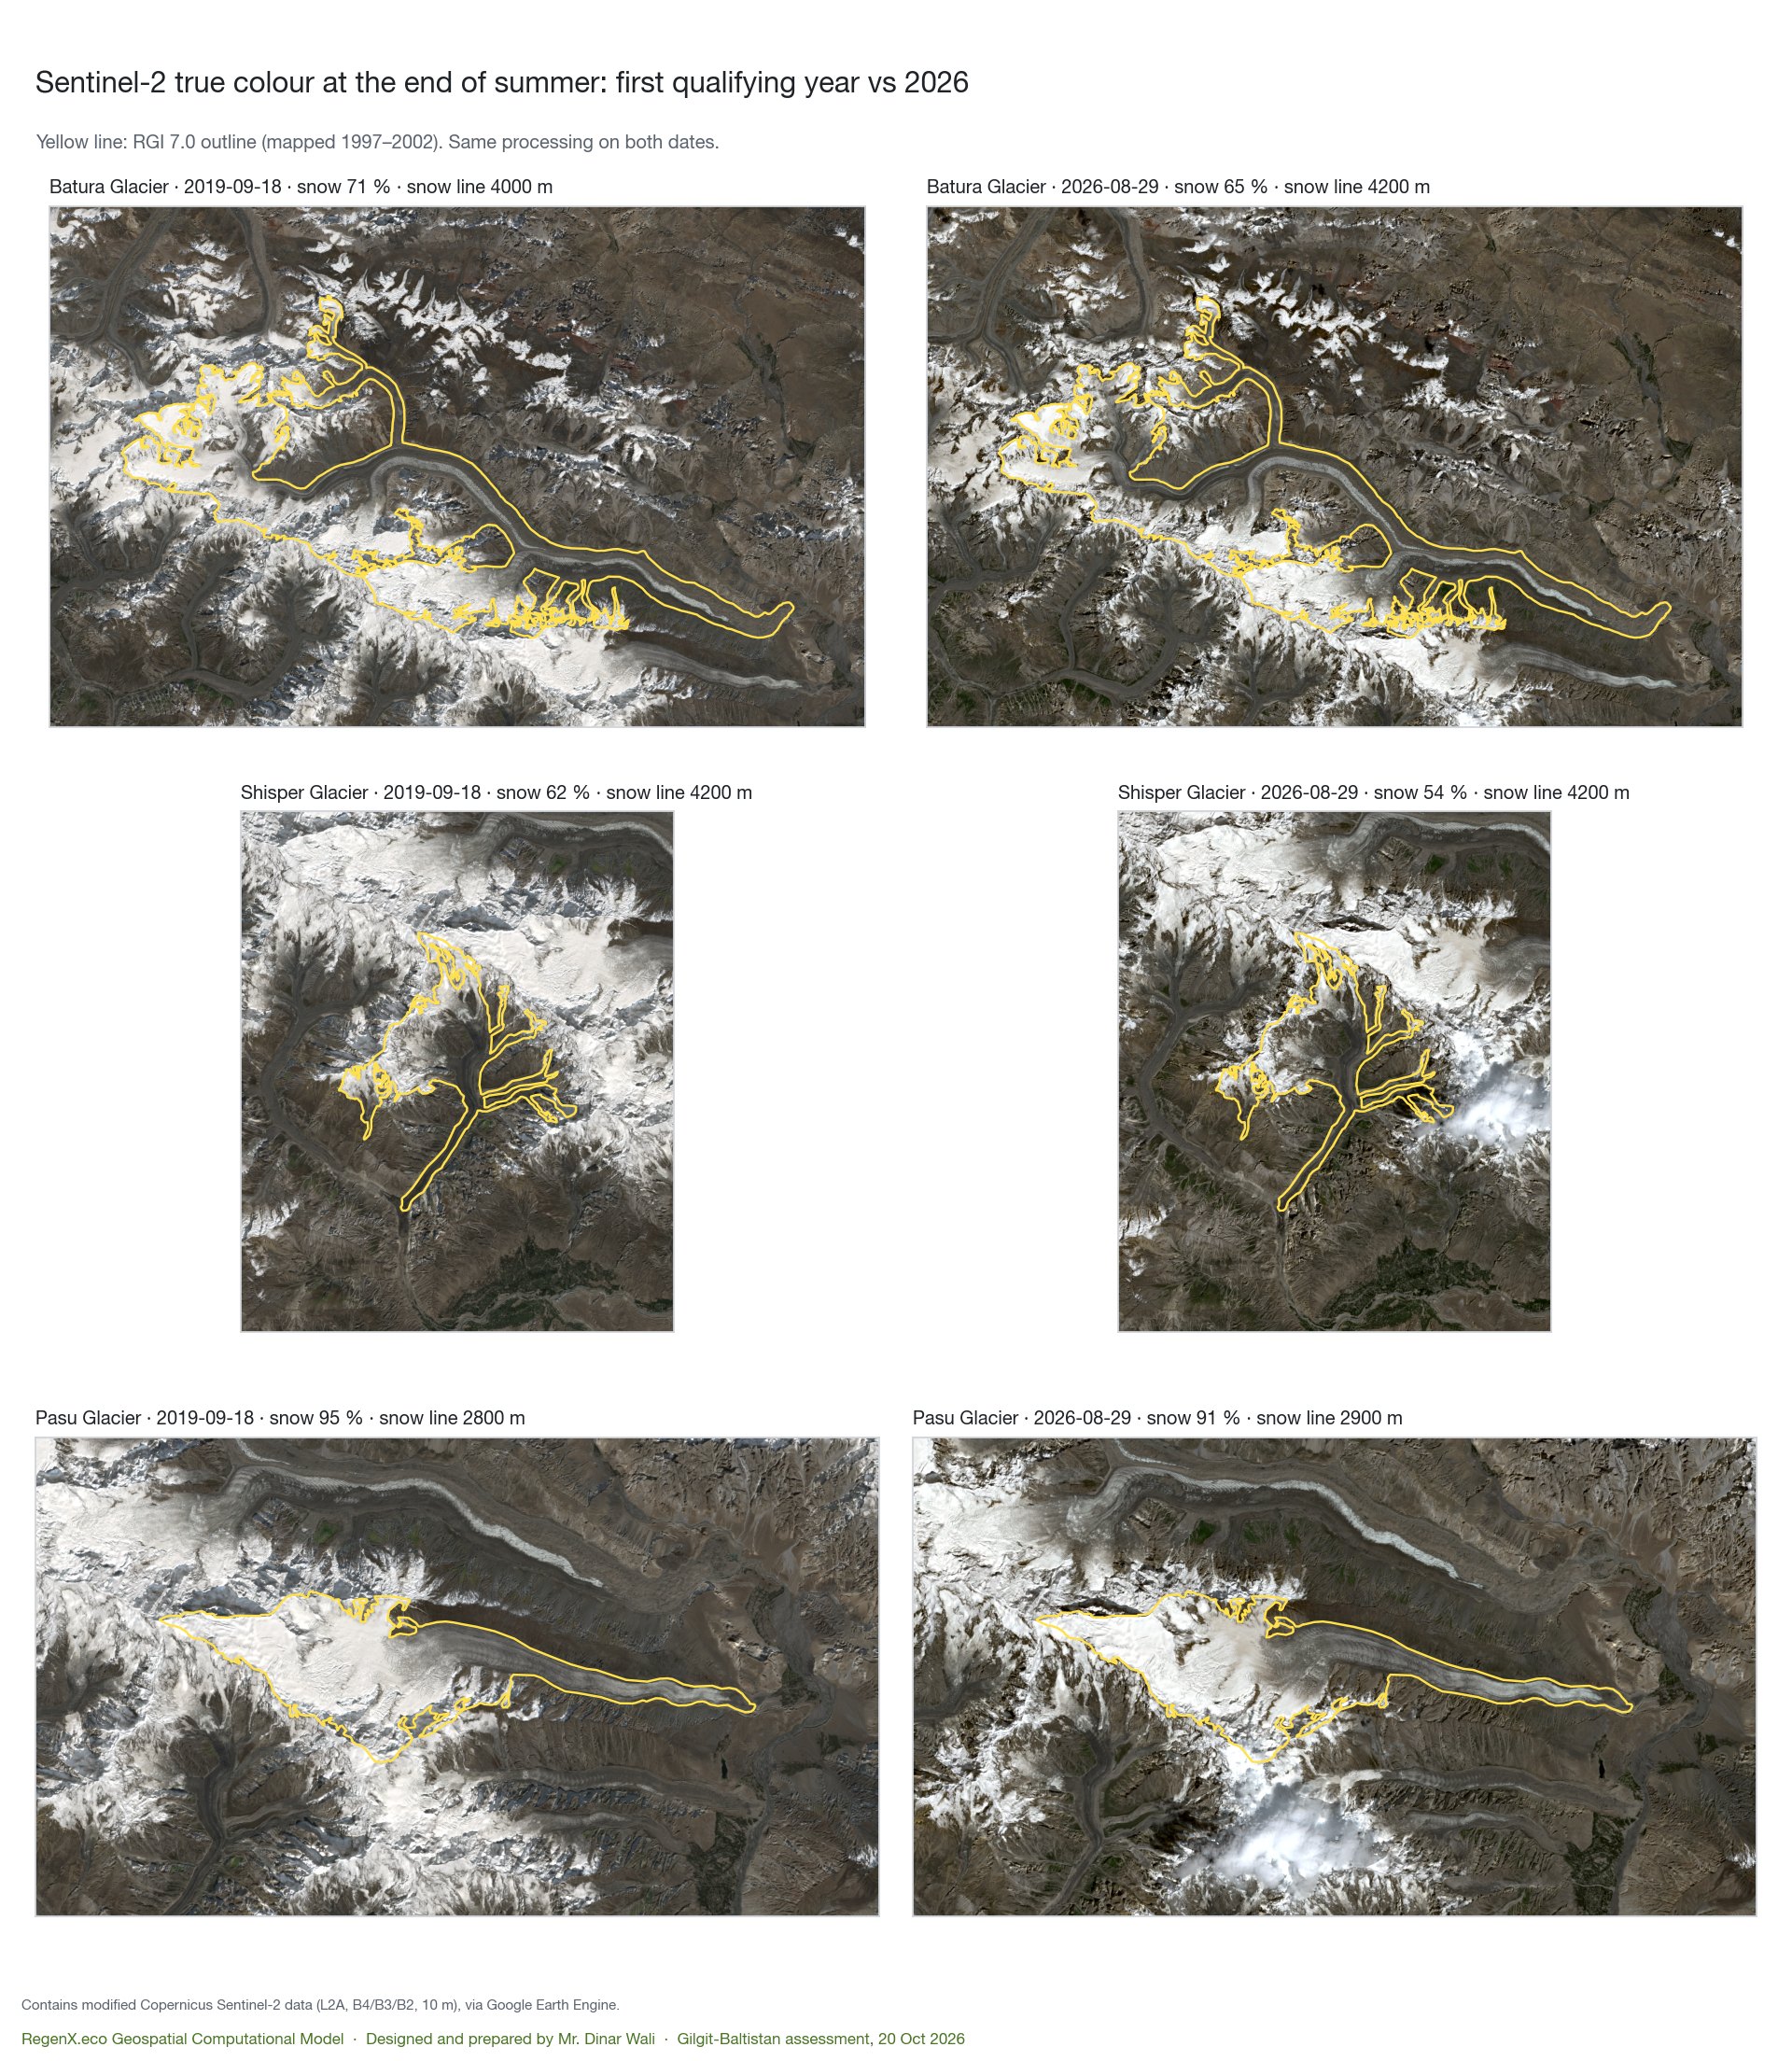
- MeasuredLess snow survives on the ice each summer. August snow cover on GB's glaciers is falling by 0.4 percentage points a year (p = 0.04), with the three barest Augusts in 2022, 2024 and 2025. On six key glaciers, Sentinel-2 records the lowest end-of-summer snow cover of its record (2017–19 onward) in 2025 or 2026 at all six. Seasonal snow cover over GB as a whole shows no trend.
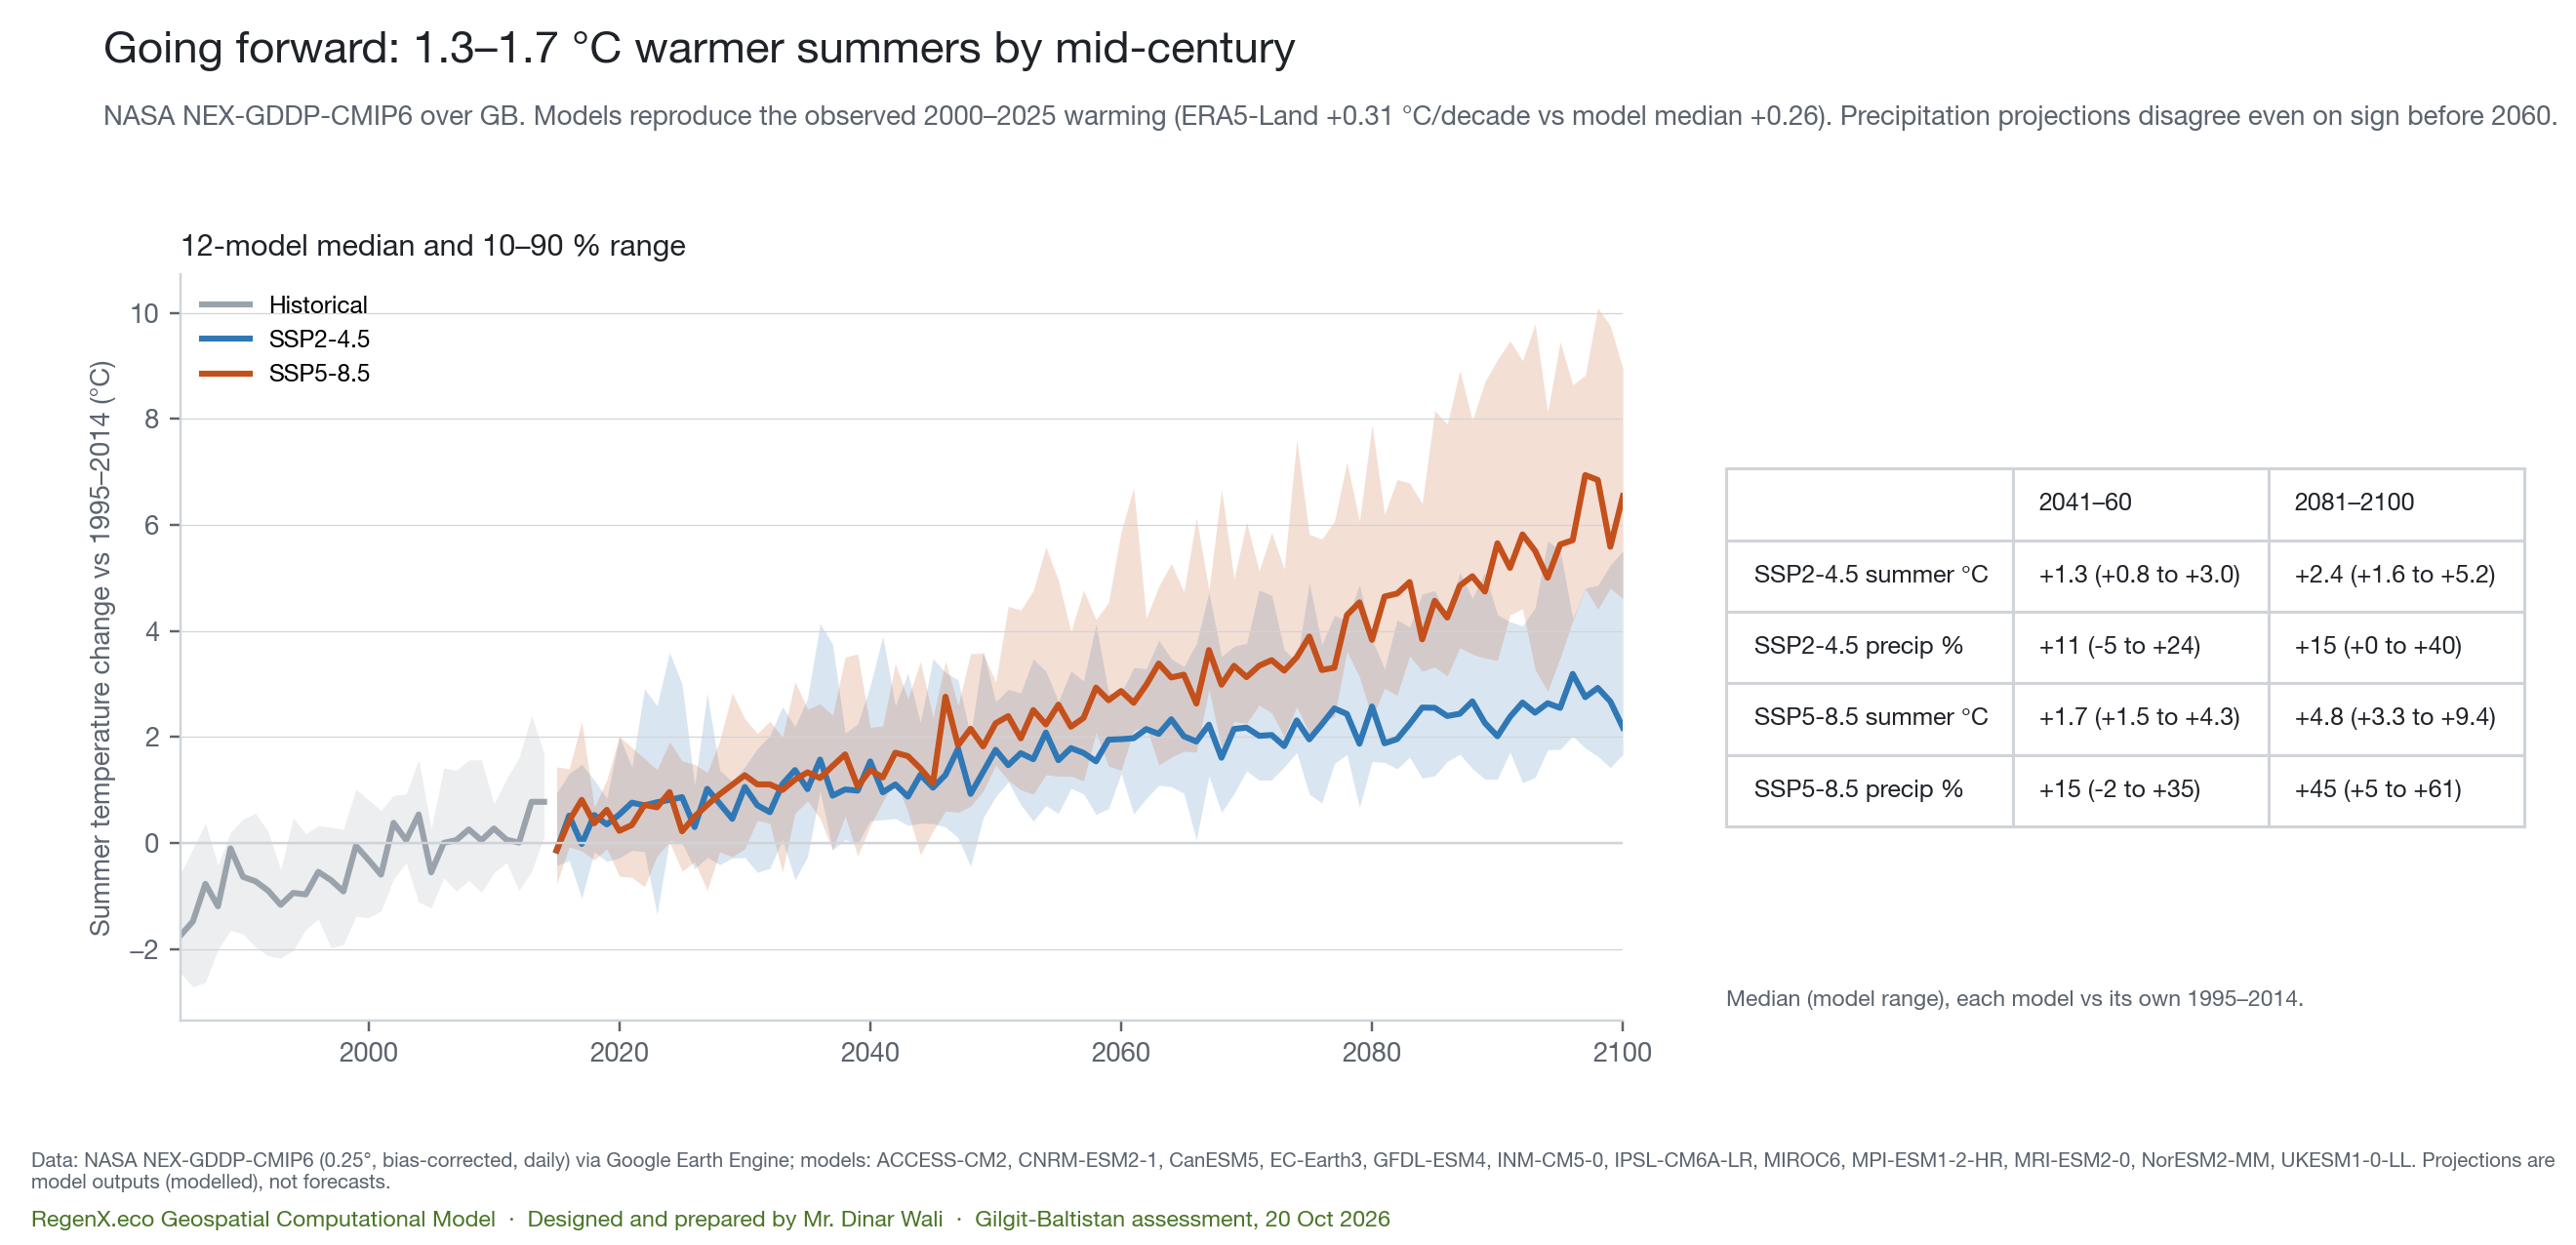
- ModelledGoing forward, summers warm 1.3–1.7 °C by mid-century (2041–60, SSP2-4.5 and SSP5-8.5 medians of 12 CMIP6 models), and +2.4 to +4.8 °C by 2081–2100. The models reproduce GB's observed warming since 2000. Their precipitation projections disagree, even on sign, before 2060.
What this means for water: today's meltwater includes ice that is not replaced. That deficit melt props up summer river flow while the glaciers shrink, and it ends when the ice runs out. The 2025–26 low shows how fast GB's storage buffer can be drawn down in a hot year. These are inferences from the measurements, not a flow forecast. River-gauge data was not part of this assessment.
The glaciers
Stored water, measured from orbit
What is driving it
Six key glaciers up close
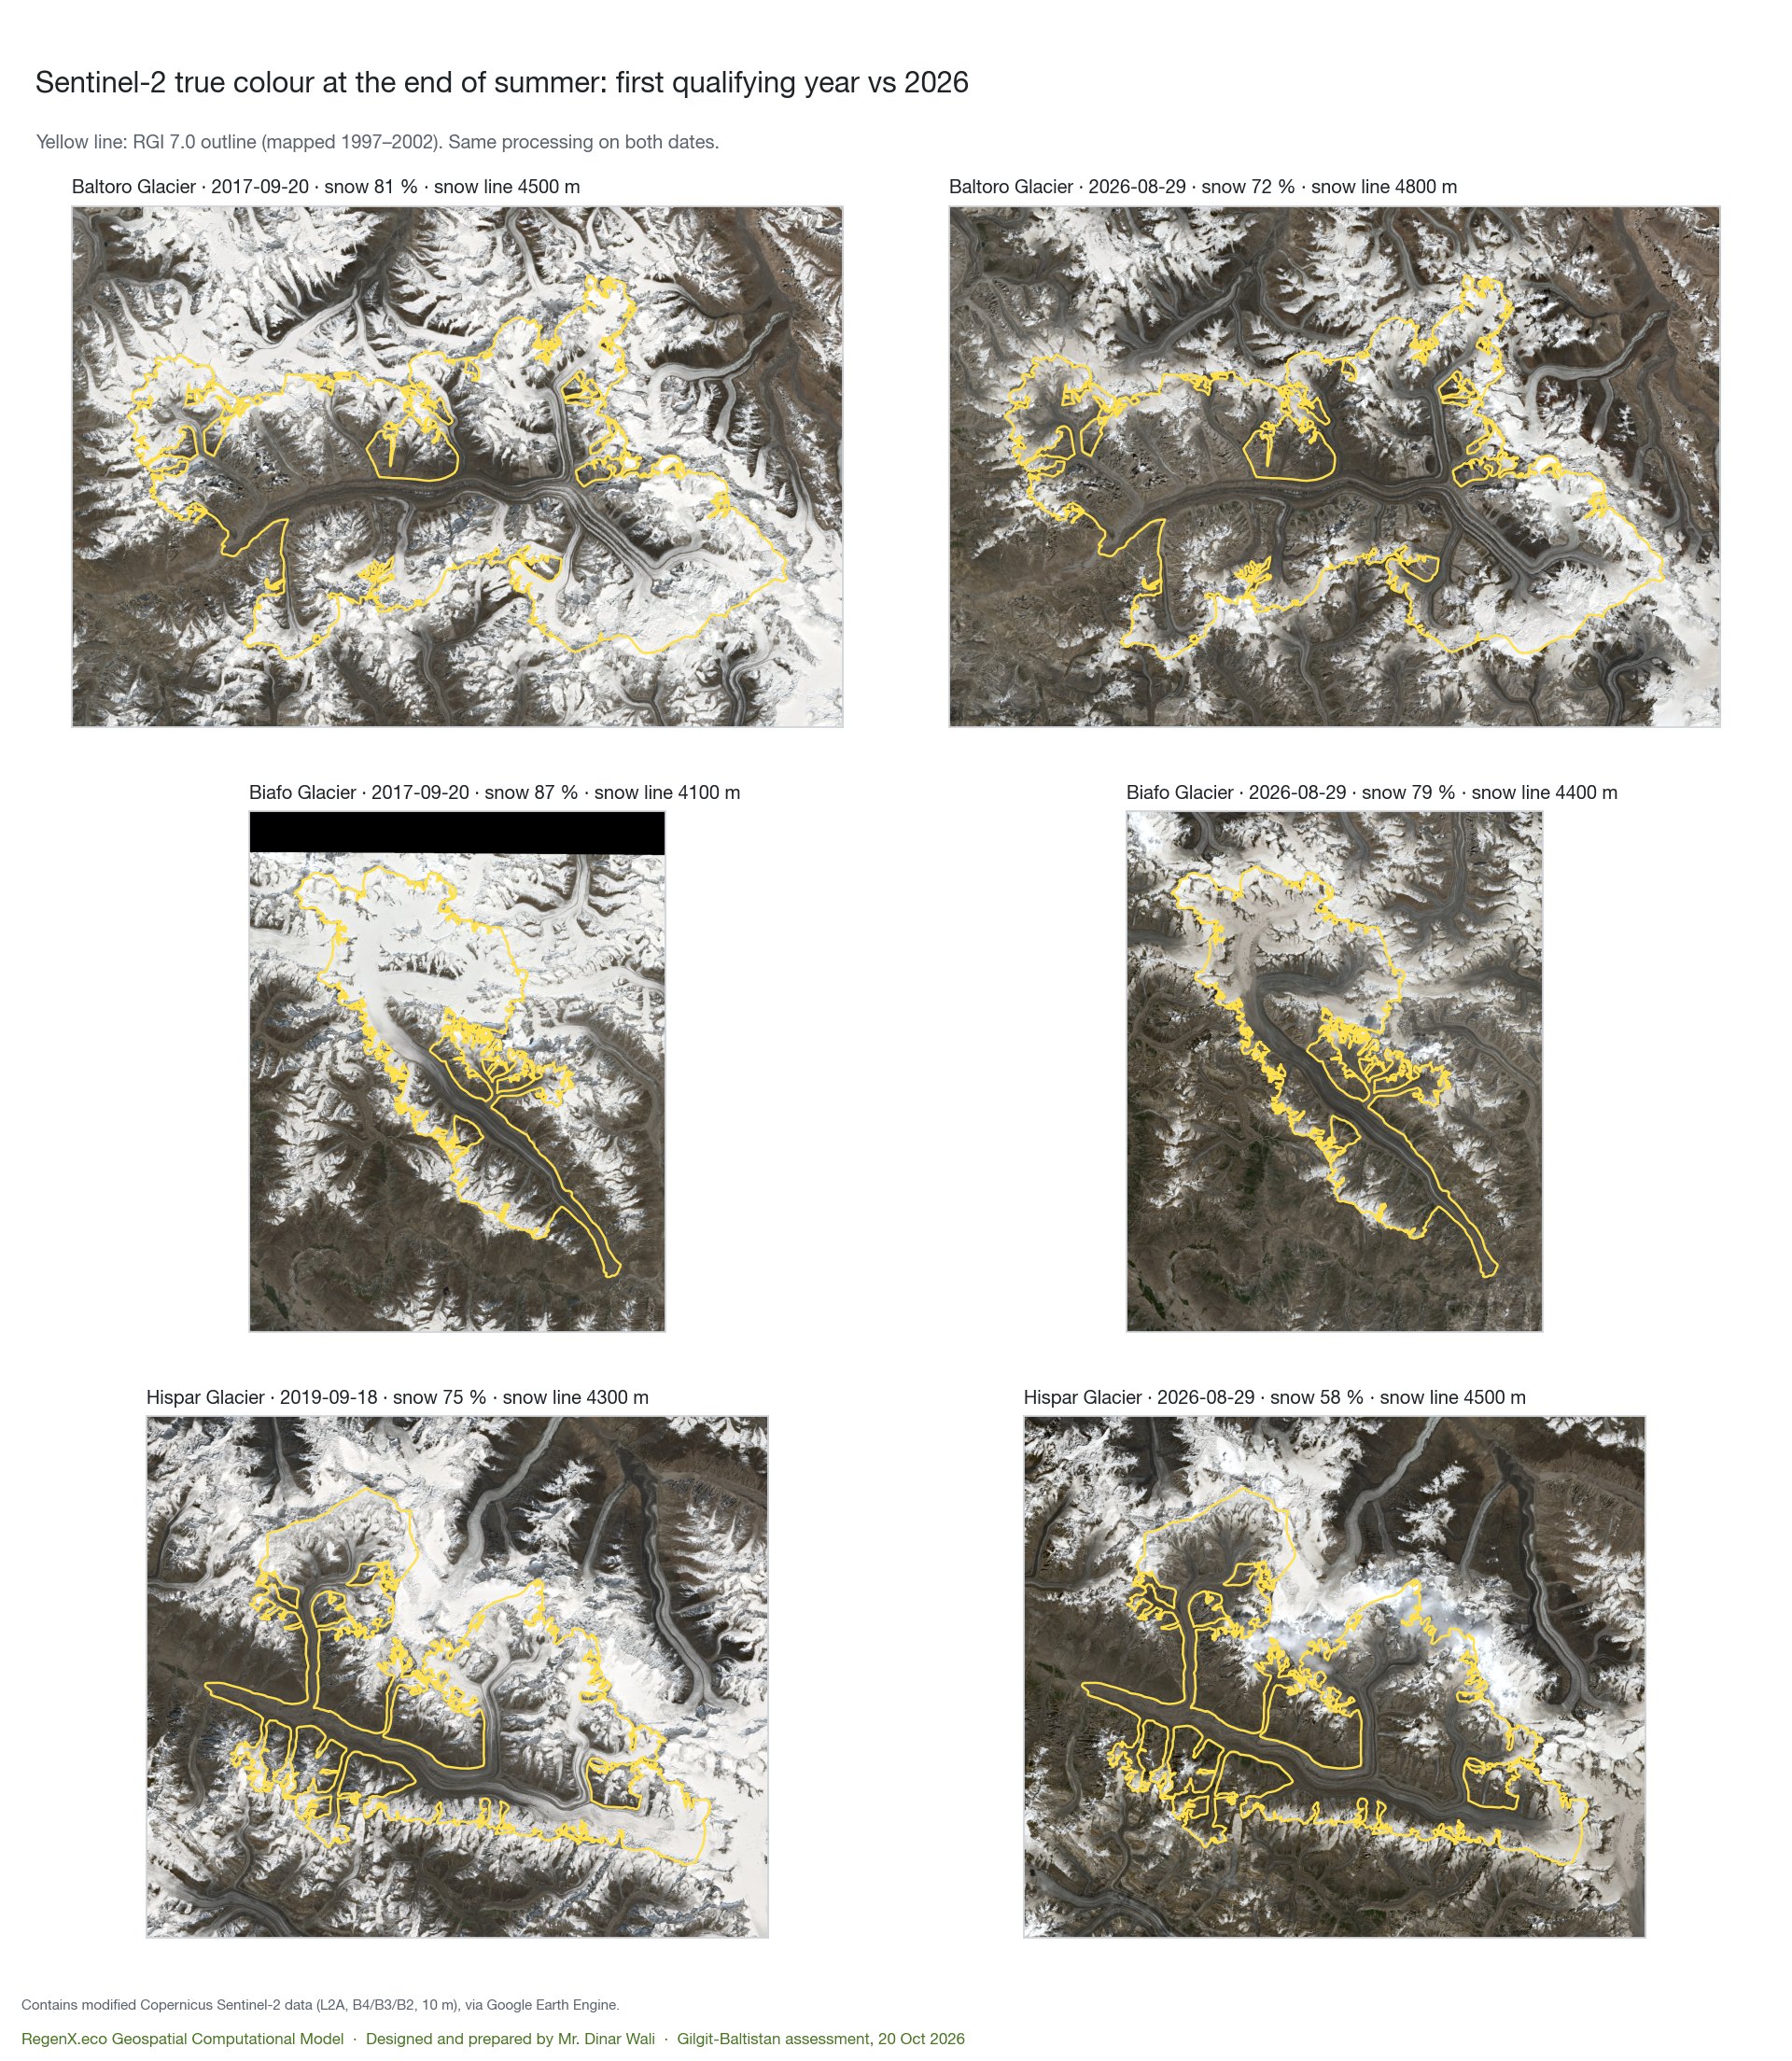
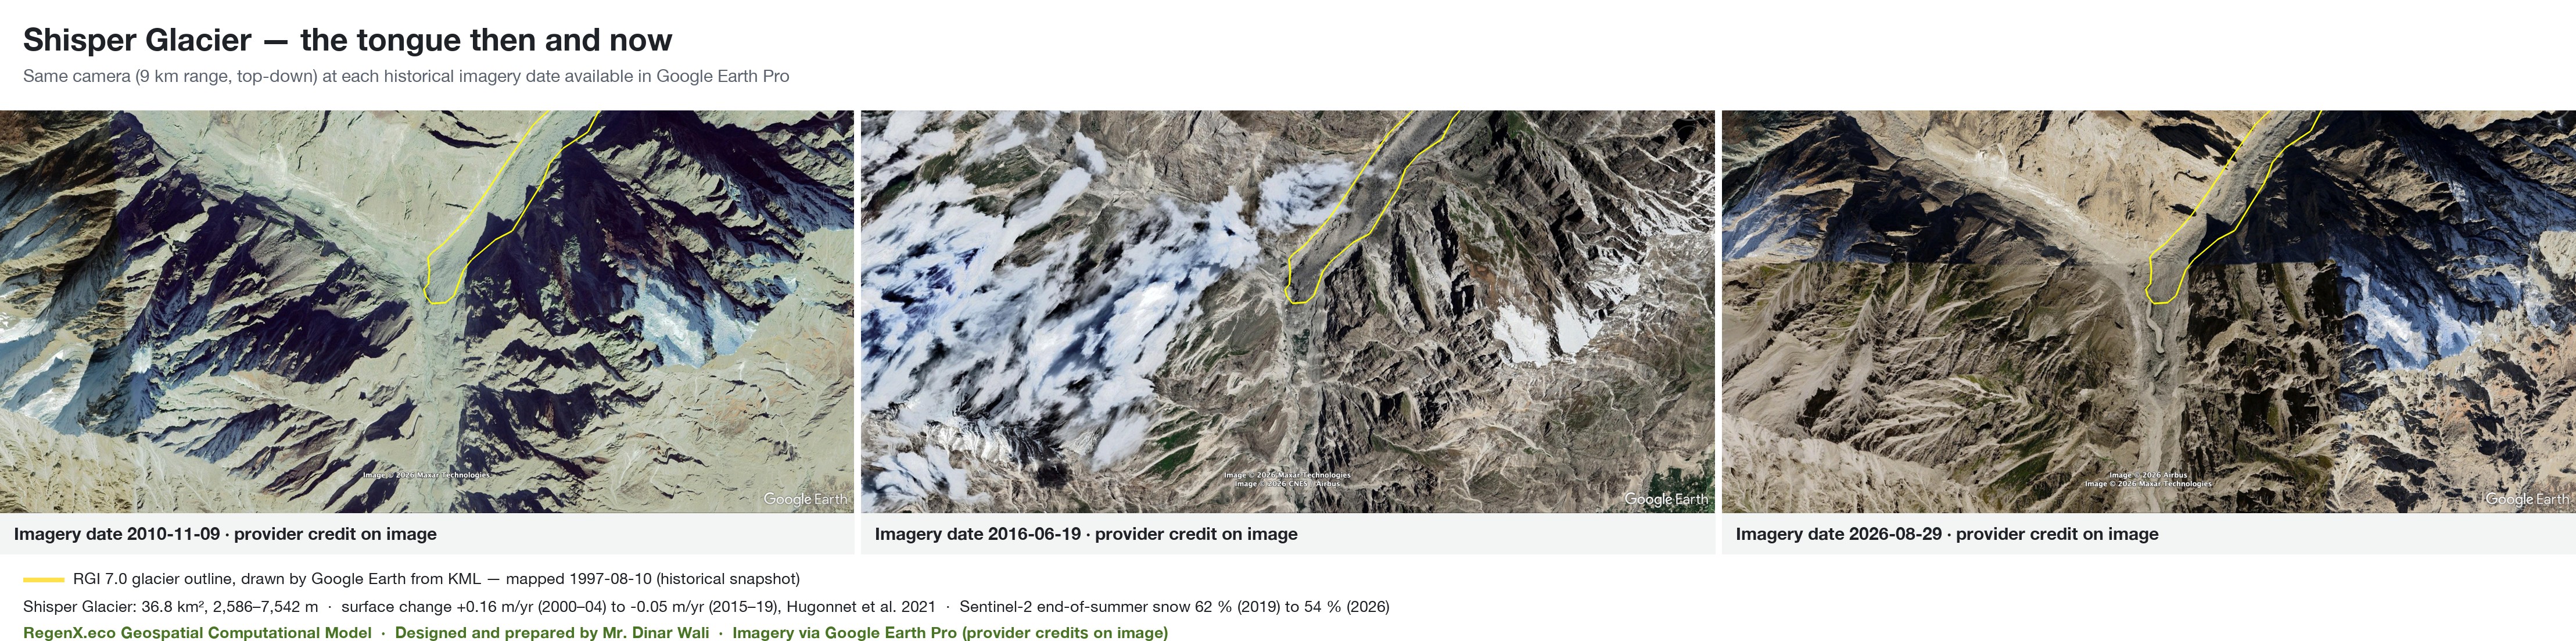
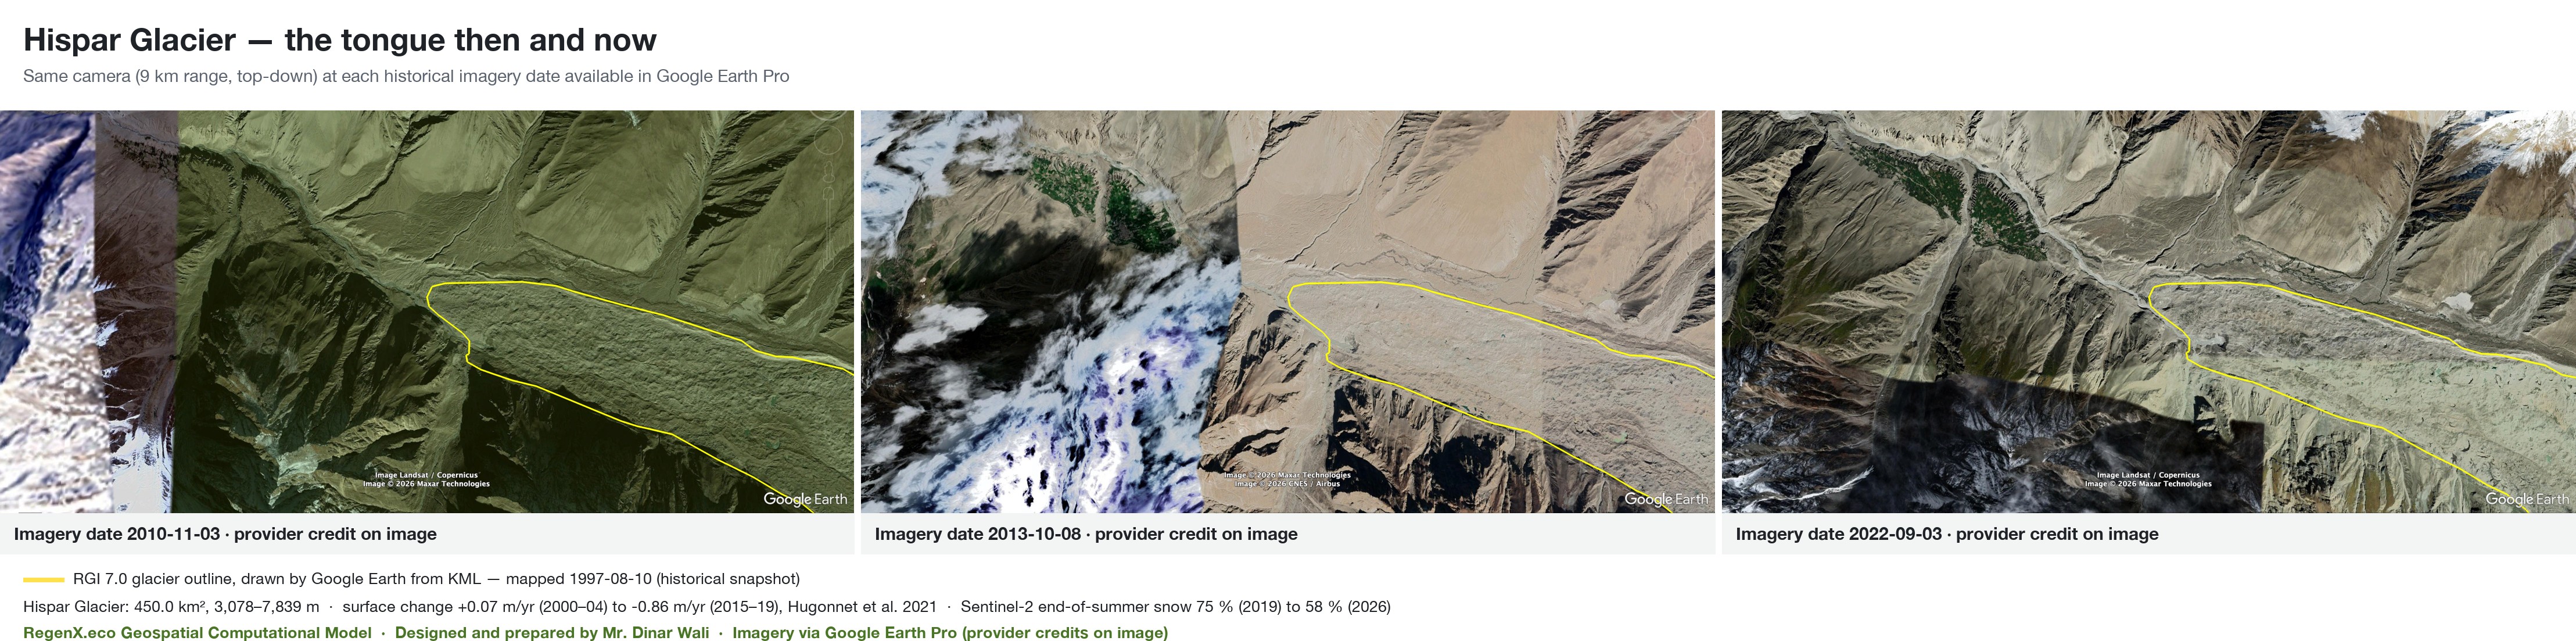
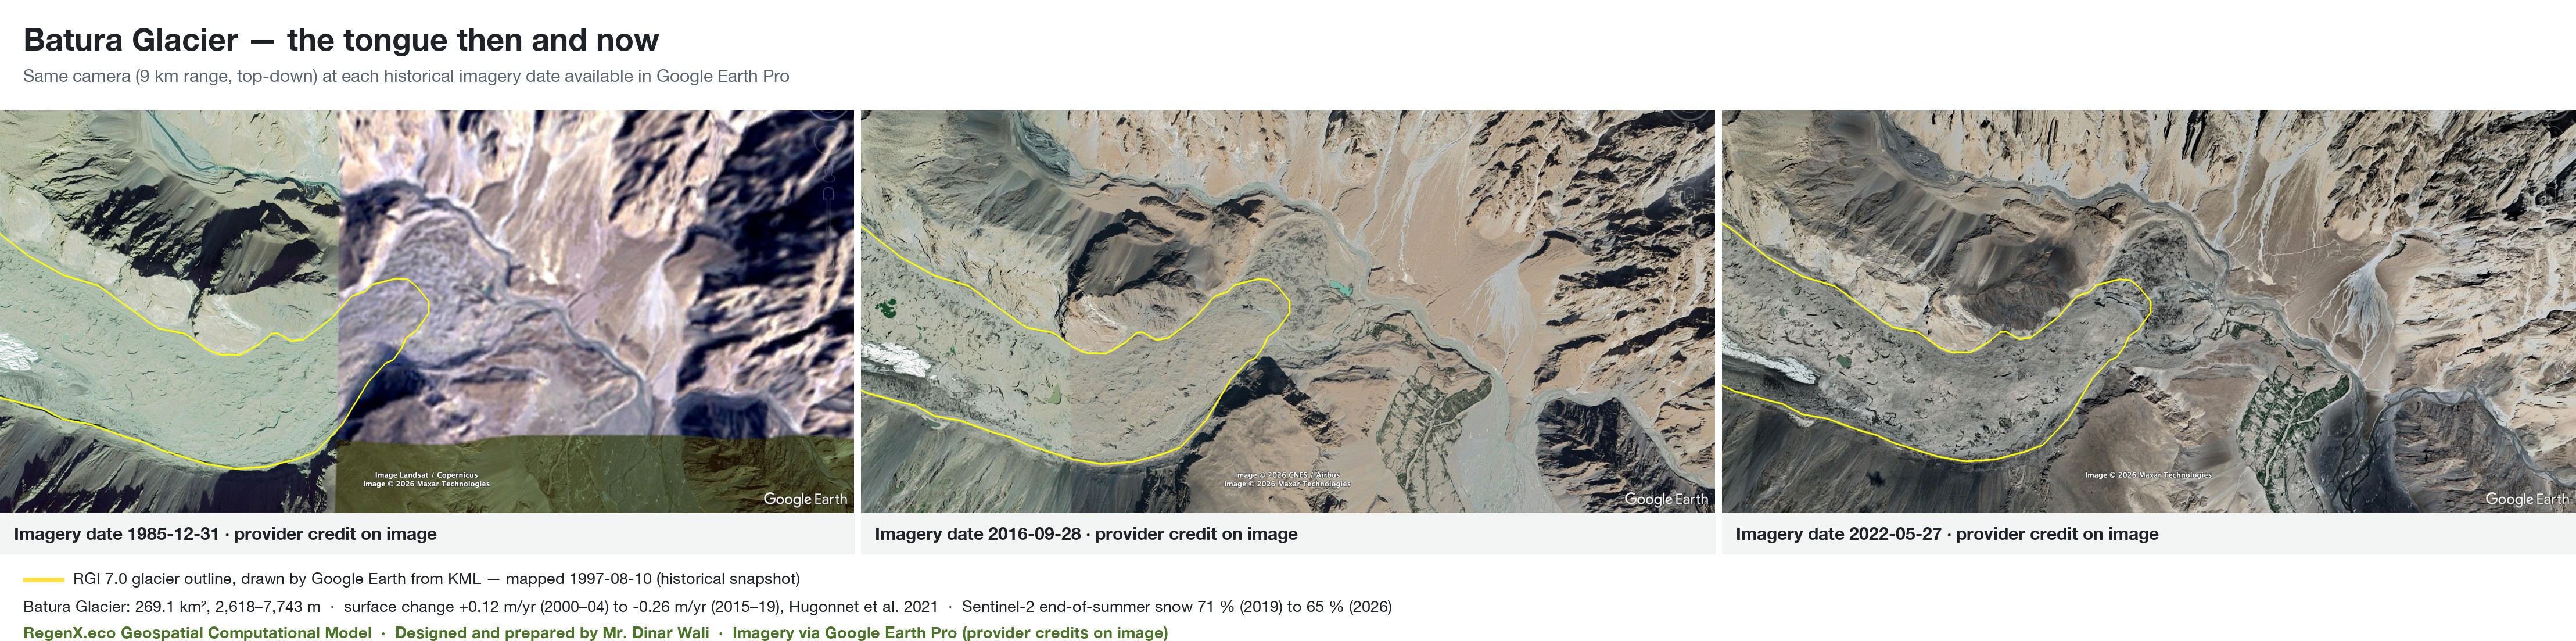
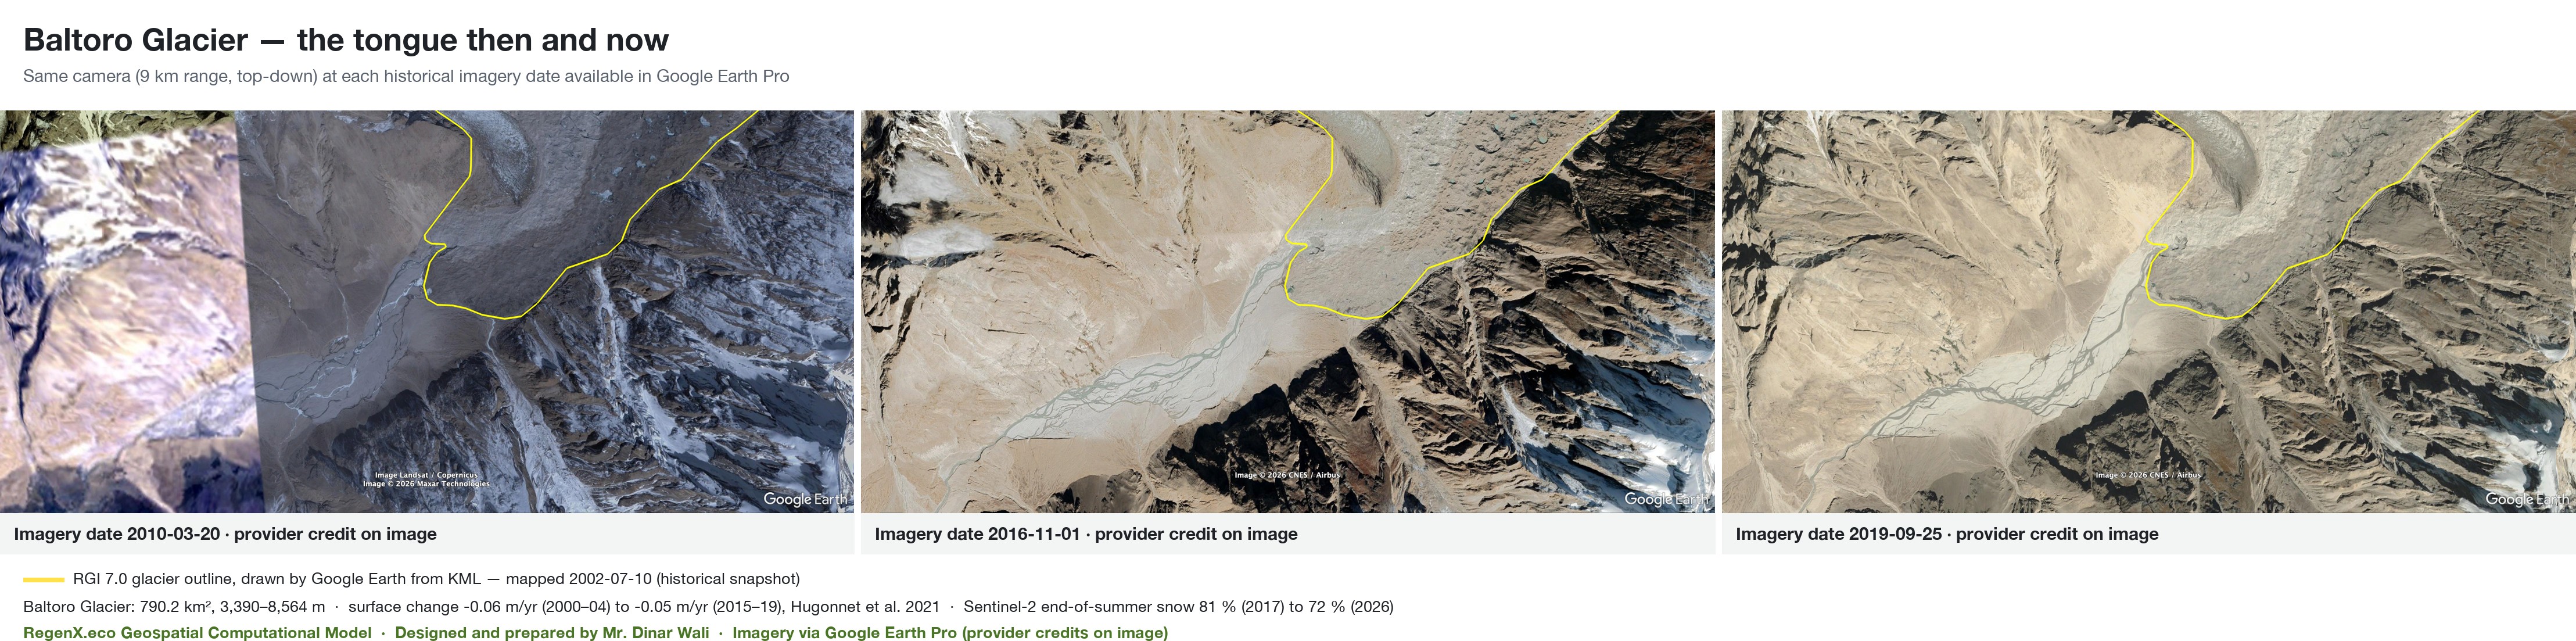
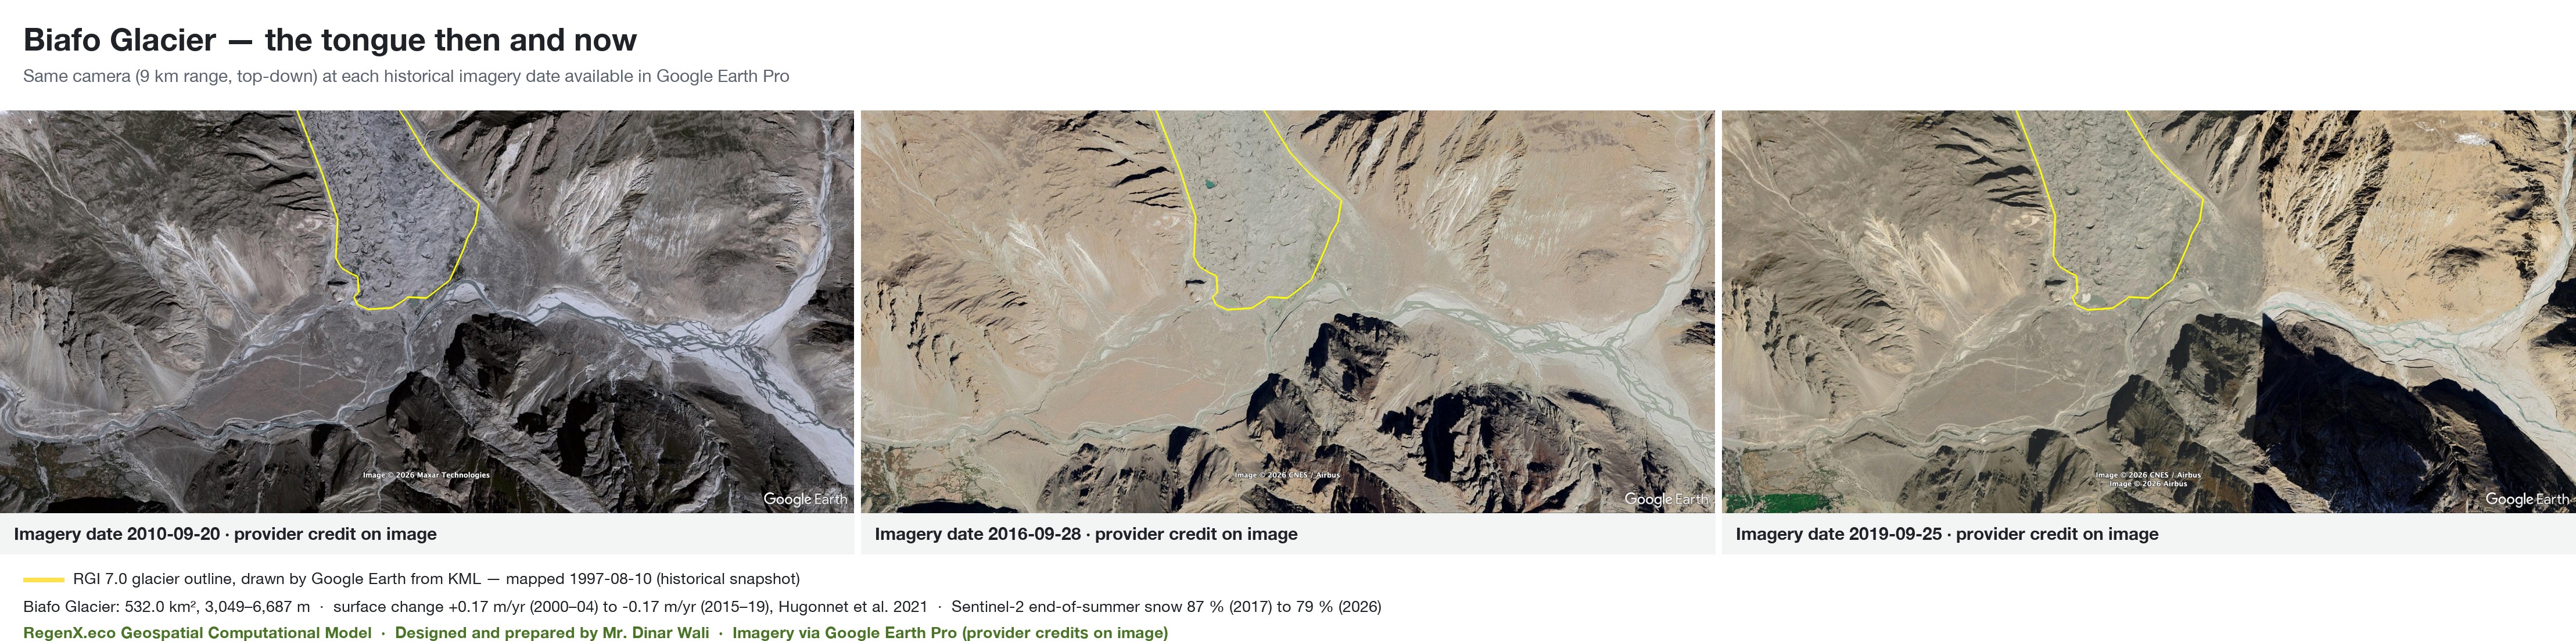
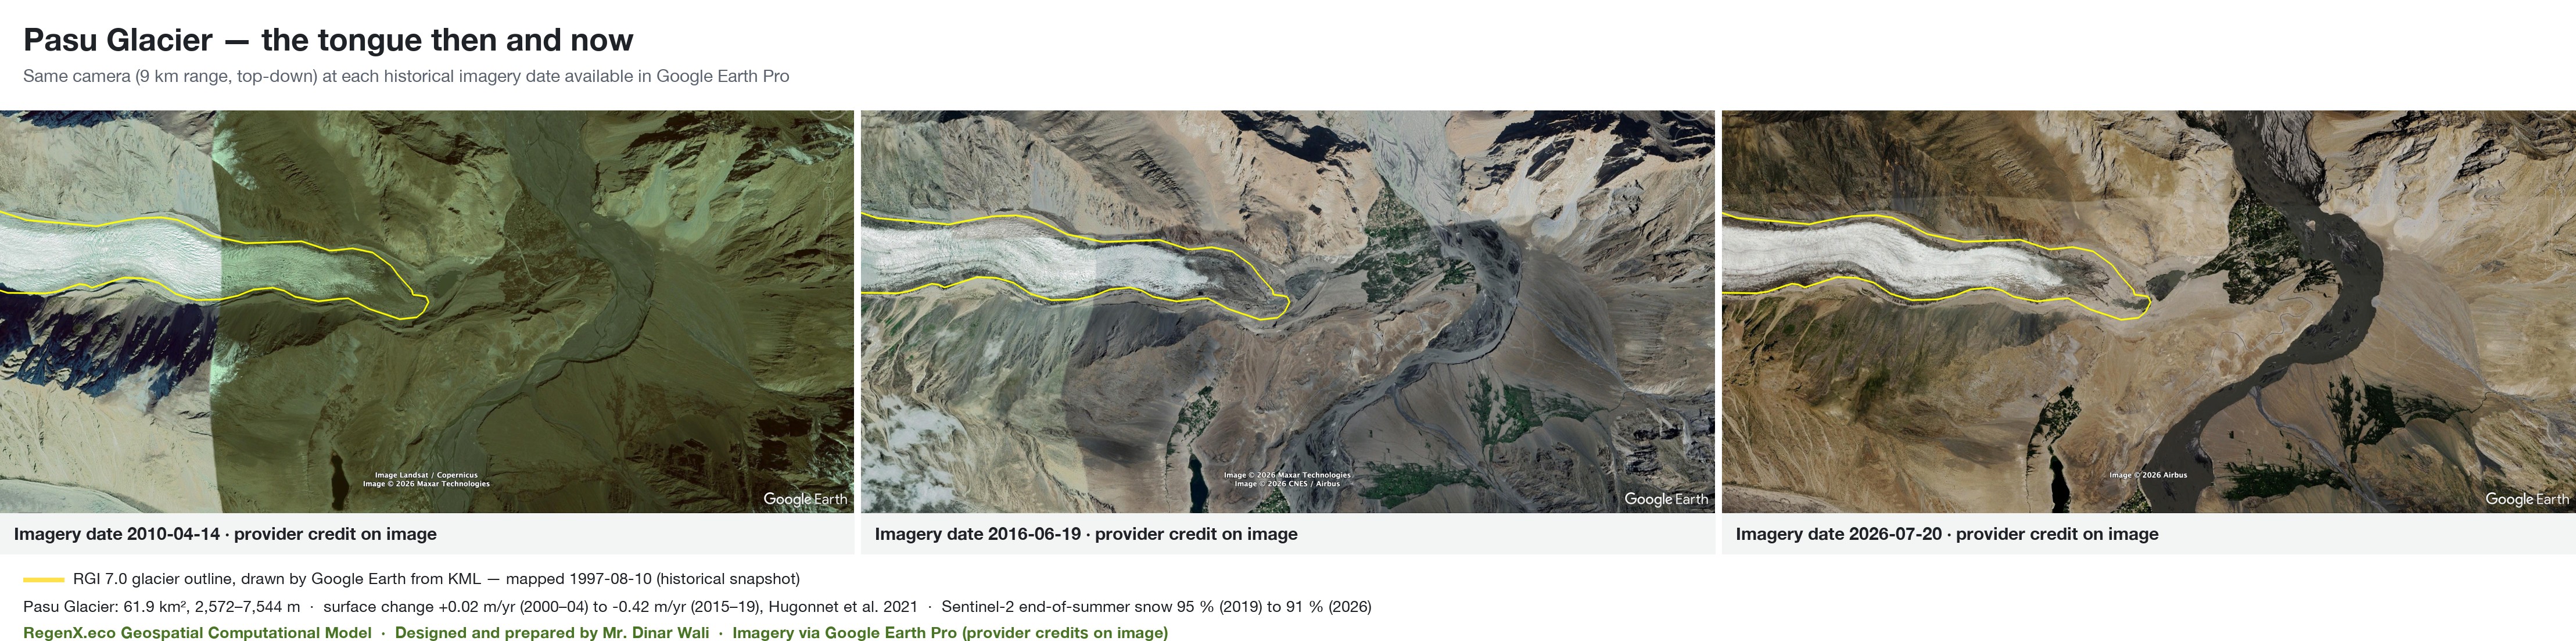
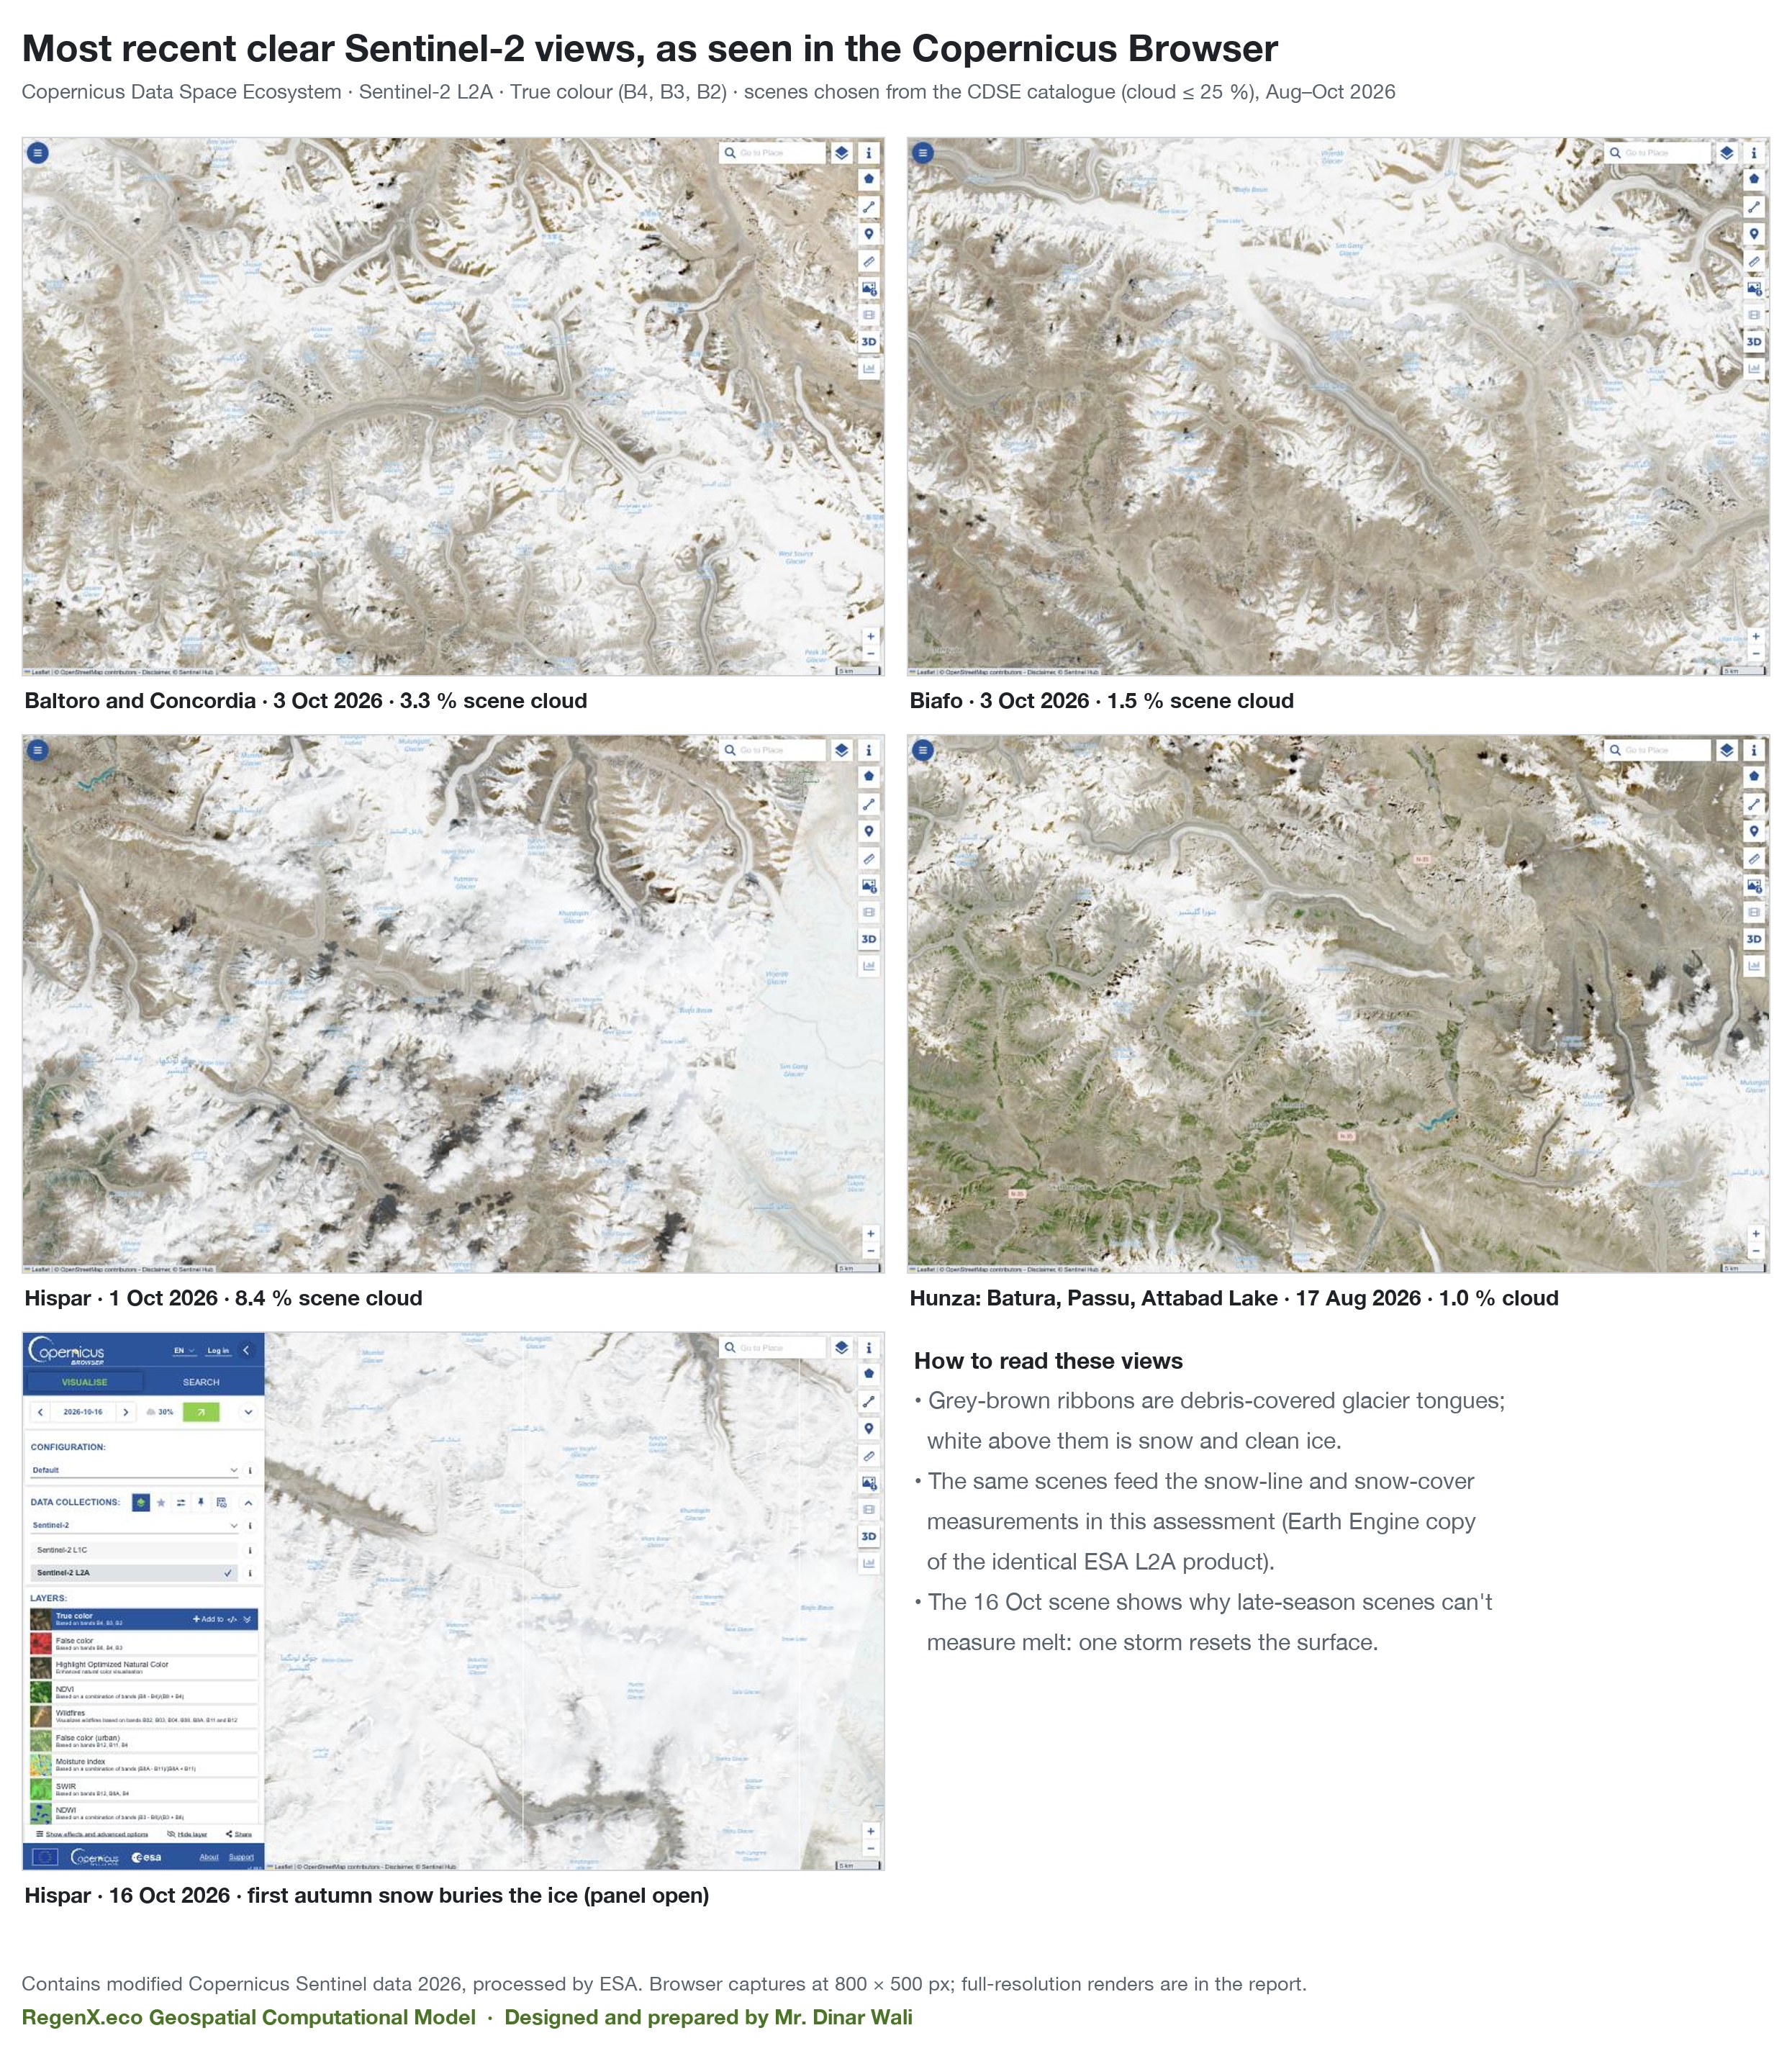
Baltoro, Biafo and Hispar (Shigar and Nagar) and Batura, Passu and Shisper (Hunza) were followed with Sentinel-2 every end of summer since L2A coverage began, and imaged in Google Earth Pro at every high-resolution date available.
High-resolution imagery in Google Earth Pro
Each glacier tongue was captured top-down from the same camera at every high-resolution date Google Earth Pro holds (earlier imagery over GB is Landsat-grade only). The yellow line is the RGI 7.0 outline, drawn by Google Earth itself from KML; imagery dates were read from Earth's status bar.
Going forward
Glaciers here store water as ice and release it in summer, when downstream demand peaks. A shrinking glacier first releases more water, then less, once there is not enough ice left to sustain melt. This assessment did not model when that "peak water" turning point comes, so no date is given here.
What the measurements do support:
- The ice buffer is being spent faster. Glacier loss grew about 2.7-fold from 2005–09 to 2015–19 (−0.044 to −0.120 m w.e./yr), and hot summers since then (2022, 2024, 2025) produced the barest glaciers in 26 years of MODIS.
- Warming continues. Another 1.3–1.7 °C of summer warming by mid-century is the model median. Observed summers already run up to 2.8 °C above the 2001–20 mean in the hottest years.
- Dry years will lean harder on stored water. Seasonal snow has no trend but swings ±20 % between years. When a low-snow year coincides with a hot summer, the ice and groundwater buffer, now visibly depleted, is what remains.
Validation
| Test | What it checks | Result | Outcome |
|---|---|---|---|
| Glacier inventory copy | Earth Engine RGI 7.0 against the NSIDC download used in earlier GB work | Shisper 14-08488: 36.83 km², 1997-08-10, surge 3 — identical | PASS |
| Independent GRACE solutions | CSR vs GFZ vs JPL, GB annual means | r = 0.95 (GFZ), 0.97 (JPL); 2024: −16.4 / −17.3 / −16.3 cm | PASS |
| 2025–26 drop in a second solution | Does GFZ show the CSR drop? | Yes in direction; 35 % smaller (2026: −32 vs −50 cm) | PARTLY |
| Spatial pattern | Is the 2025–26 drop a uniform satellite offset? | GB −34, Ladakh −30, Pamir −24; W Kunlun −3, C Tibet 0 cm | PASS |
| Glacier loss vs GRACE, 2010–19 | Does GB storage loss cover the measured glacier loss? | GRACE −0.33 km³/yr vs glaciers −1.17 Gt/yr; same sign, magnitude off | FAIL |
| Robust to the Siachen sector | Glacier acceleration with and without that sector | Monotonic in both; −0.10 / −0.11 m w.e./yr per decade | PASS |
| Warm summers ↔ bare glaciers | ERA5-Land JJA temperature vs MODIS August glacier snow, 2001–26 | r = −0.79 (p 1×10⁻⁶); Spearman −0.83 | PASS |
| Snowfall explains 2025–26? | Winter precipitation and spring snow in the low years | Winters −5 %; spring snow −14 % (2025), 0 % (2026) | NO |
| Climate models vs observations | CMIP6 2000–25 summer warming against ERA5-Land | ERA5 +0.31 °C/decade; models 0.10 to 1.74, median 0.26 | PASS |
| Sentinel-2 record low | Lowest end-of-summer snow in 2025 or 2026? | 6 of 6 glaciers; significant trend only at Hispar (p 0.03) | PASS |
| Earth Pro imagery dates | OCR dates against the status bar read by eye | 4 of 4 Shisper dates match after the parser fix | PASS |
The GRACE–glacier mismatch is reported as a failure. GB is only one or two GRACE mascons wide, so the satellite sees a blurred regional signal, while the glacier loss is concentrated in a few large valleys and partly on the GB boundary. GRACE at this scale cannot close GB's glacier budget.
Traps checked
- Single GRACE months. GB swings 65 cm between July and August 2026, which is solution noise at this scale. Only annual means are used.
- Sentinel-2 processing offset. Earlier GB melt series read raw Planetary Computer values without the post-2022 offset. This assessment uses the harmonised collection, so the full record sits on one radiometric scale.
- Tile strips. Large glaciers straddle Sentinel-2 tiles. All tiles of a date are mosaicked before scoring, and scenes need 90 % in-outline coverage.
- Clean ice read as snow. NDSI cannot separate clean ice from snow, so Passu's values are excluded from interpretation.
- Old outlines. RGI 7.0 outlines date from 1997–2002. They are drawn as a historical reference, and Shisper's 2026 tongue now runs well beyond its 1997 outline after the 2018–20 surge.
- Late-season snow. The newest Hispar scene (16 Oct 2026) is under fresh snow, so melt is measured on scenes nearest 1 September.
- Disputed ground. The geoBoundaries GB polygon includes the Siachen sector, administered by India. Totals are given with and without it.
Arithmetic
Sources and tools
- Glacier outlines: Randolph Glacier Inventory 7.0 (GLIMS/NSIDC 0770), Earth Engine community copy, checked against the NSIDC download.
- Glacier change: Hugonnet et al. 2021, Nature 592:726 (ASTER/ArcticDEM elevation time series, 100 m, 2000–2019).
- Stored water: NASA-JPL, UT-CSR and GFZ GravIS GRACE/GRACE-FO RL06 solutions.
- Snow: MODIS Terra MOD10A1 v6.1, 500 m daily, 2001–2026.
- Climate: ECMWF ERA5-Land monthly; NASA NEX-GDDP-CMIP6 (12 models, SSP2-4.5 and SSP5-8.5).
- Imagery: Copernicus Sentinel-2 L2A (Copernicus Browser and Earth Engine); Google Earth Pro historical high-resolution imagery (Airbus, Maxar Technologies, CNES), with RGI outlines rendered by Earth from KML.
- Terrain and boundaries: Copernicus GLO-30 DEM; geoBoundaries ADM1/ADM2.
Not yet established
- River flow. No discharge data was used, so the effect on Indus flow is inferred, not measured.
- Ice volume and "peak water" timing. These need ice-thickness data and a glacier model, which were not part of this work.
- Glacier change after 2019 for all of GB. Hugonnet ends in 2019; 2020–26 rests on GRACE, MODIS and six Sentinel-2 glaciers.
Downloads
- Presentation (PDF, 20 slides)
- Google Earth KMZ: 8,633 RGI 7.0 glacier outlines, the 30 largest named, six key glaciers with saved views
- All computed results (JSON) · Source code and data on GitHub