Google Earth Atlas

Nigeria CO₂ hotspots · 16 sites · 28 annotated views · prepared by Dinar Wali

Latest and historical Google Earth Pro imagery for every candidate hotspot, annotated feature by feature. Left panel: historical view (2006–2014). Right panel: latest view (2021–2026). Imagery remains © its providers (Airbus, Maxar Technologies, CNES, Landsat/Copernicus) as credited on each image.

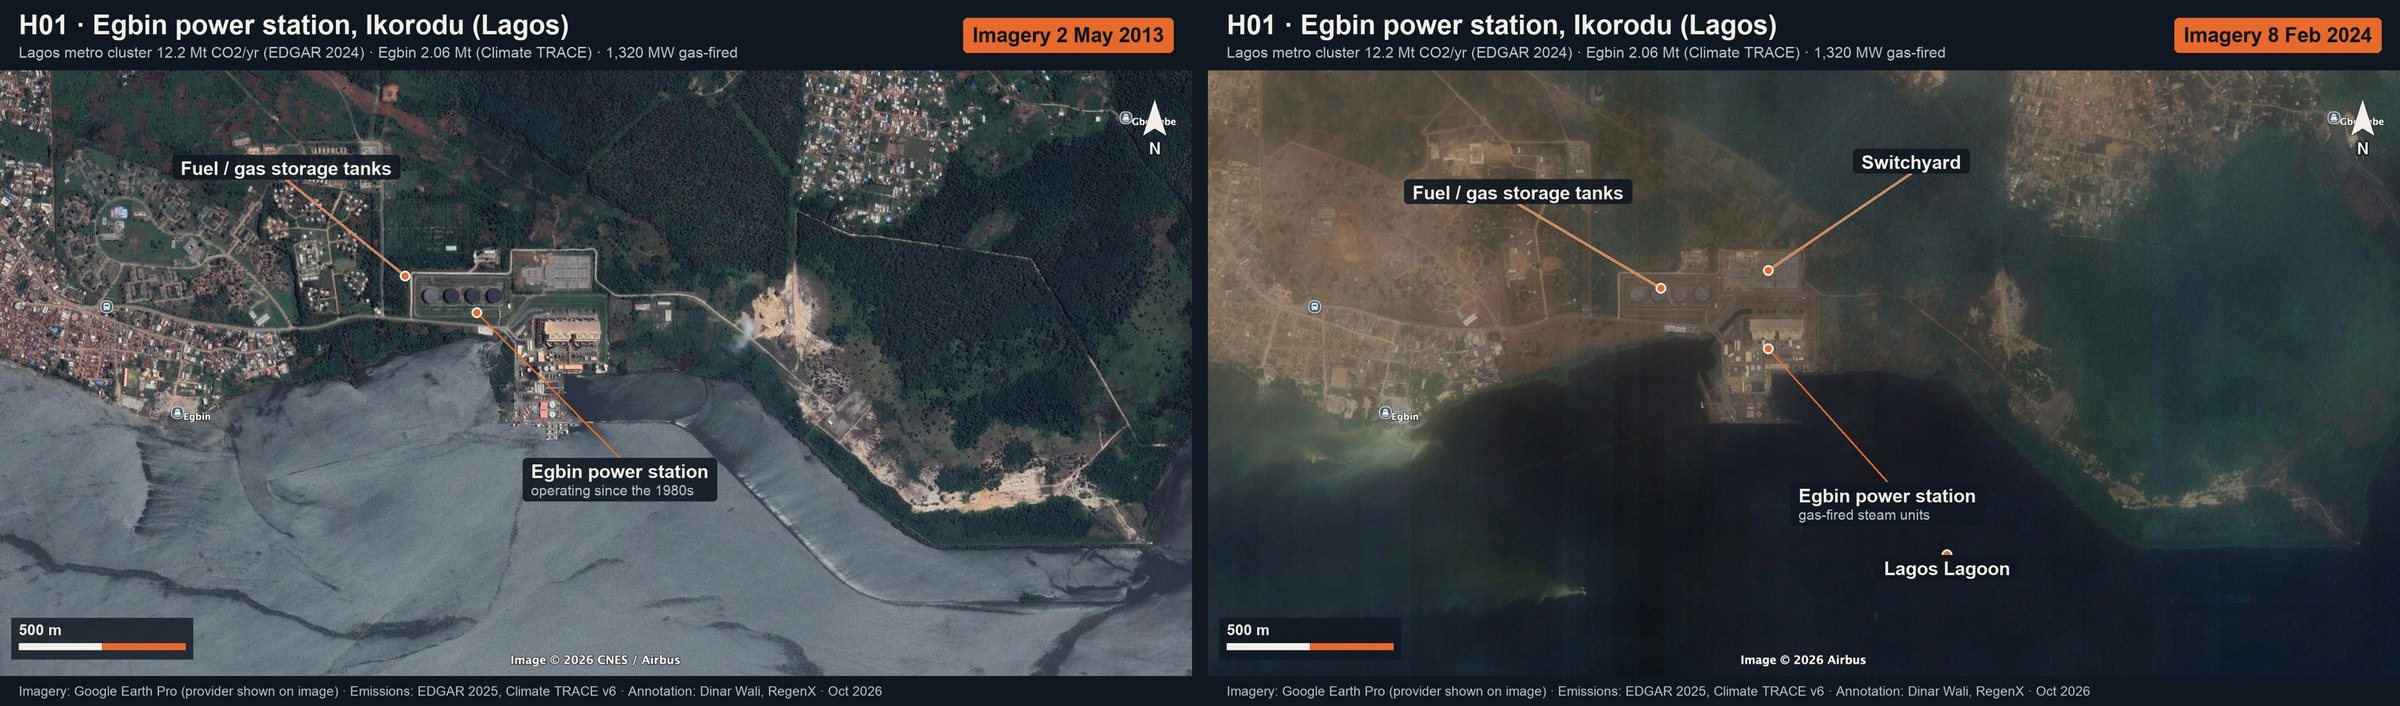
Egbin power station, Ikorodu (Lagos): annotated Google Earth imagery (then and now)
H01 · Egbin power station, Ikorodu (Lagos)Lagos metro cluster 12.2 Mt CO₂/yr (EDGAR 2024) · Egbin 2.06 Mt (Climate TRACE) · 1,320 MW gas-firedThen and now · full size: Then · Now
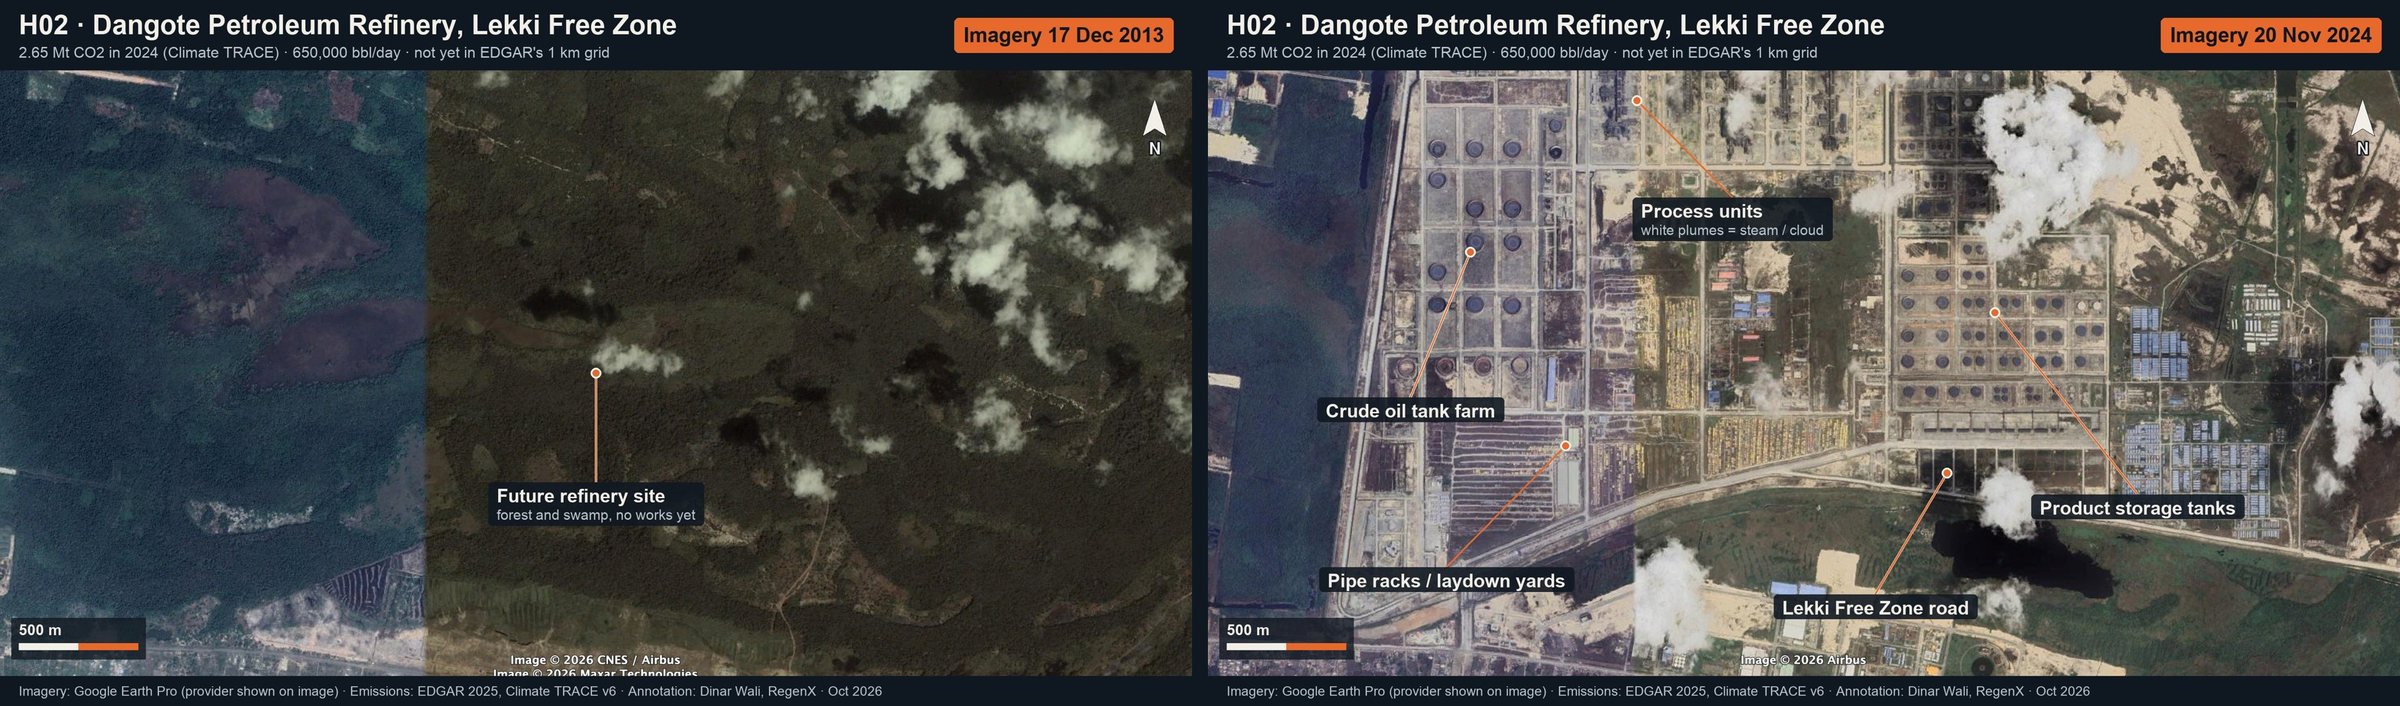
Dangote Petroleum Refinery, Lekki Free Zone: annotated Google Earth imagery (then and now)
H02 · Dangote Petroleum Refinery, Lekki Free Zone2.65 Mt CO₂ in 2024 (Climate TRACE) · 650,000 bbl/day · not yet in EDGAR's 1 km gridThen and now · full size: Then · Now
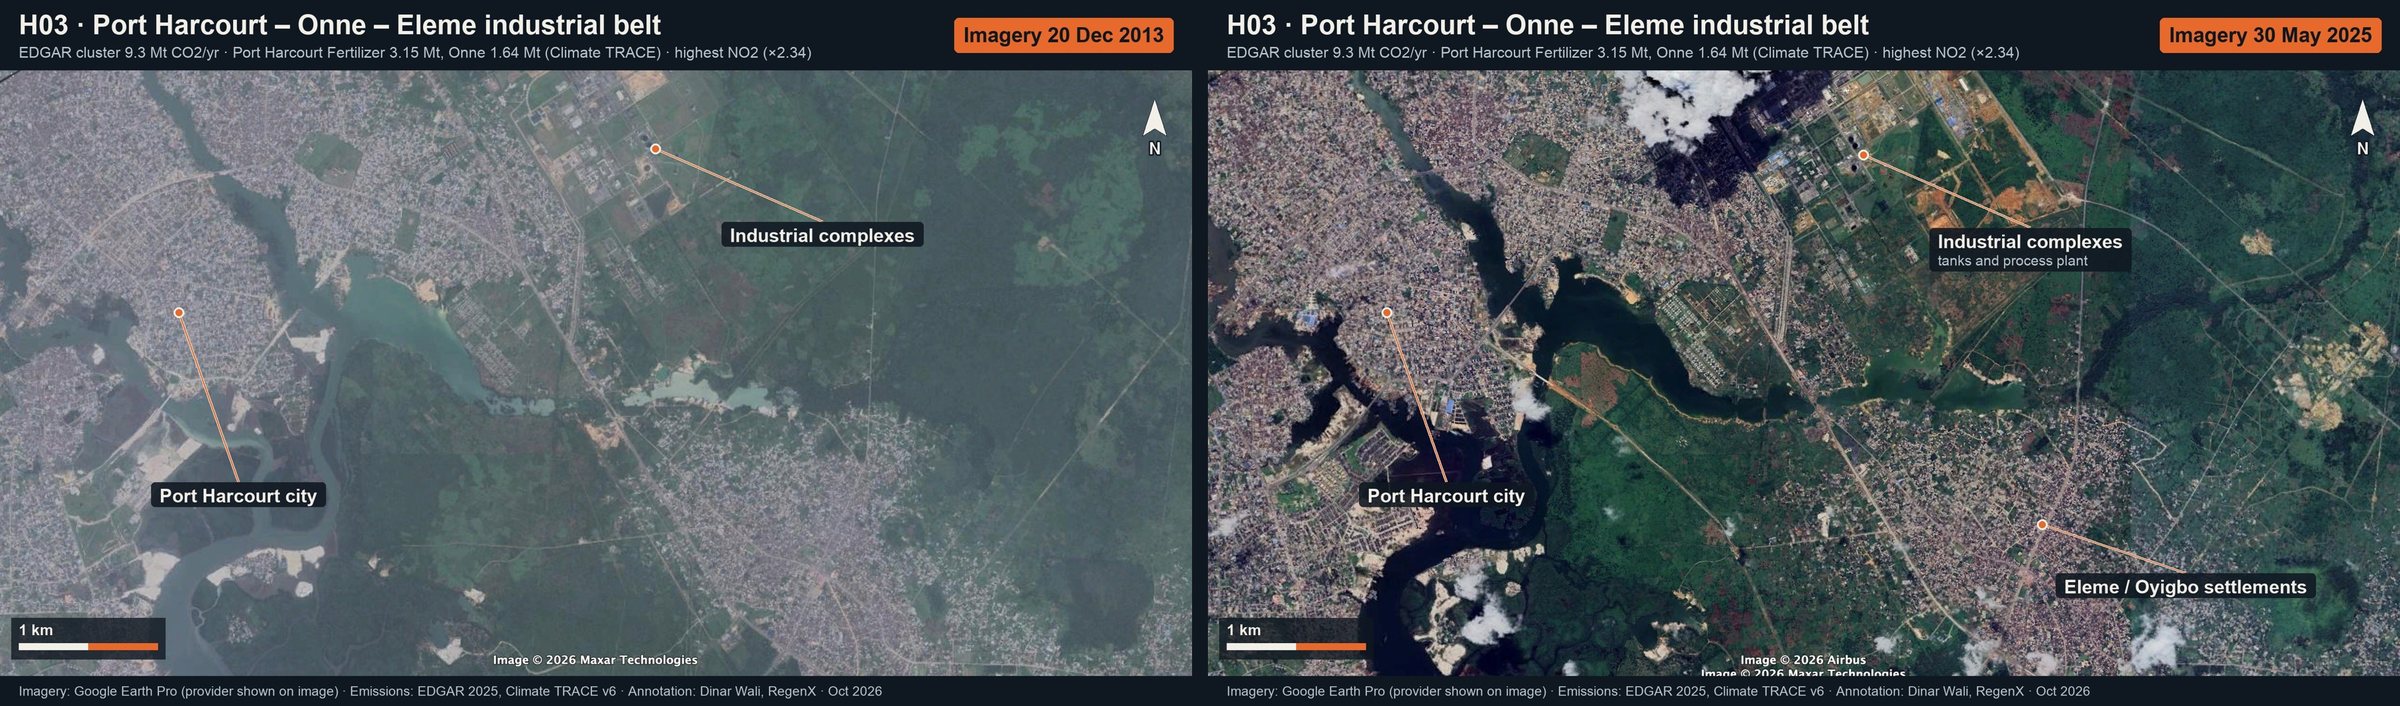
Port Harcourt – Onne – Eleme industrial belt: annotated Google Earth imagery (then and now)
H03 · Port Harcourt – Onne – Eleme industrial beltEDGAR cluster 9.3 Mt CO₂/yr · Port Harcourt Fertilizer 3.15 Mt, Onne 1.64 Mt (Climate TRACE) · highest NO₂ (×2.34)Then and now · full size: Then · Now
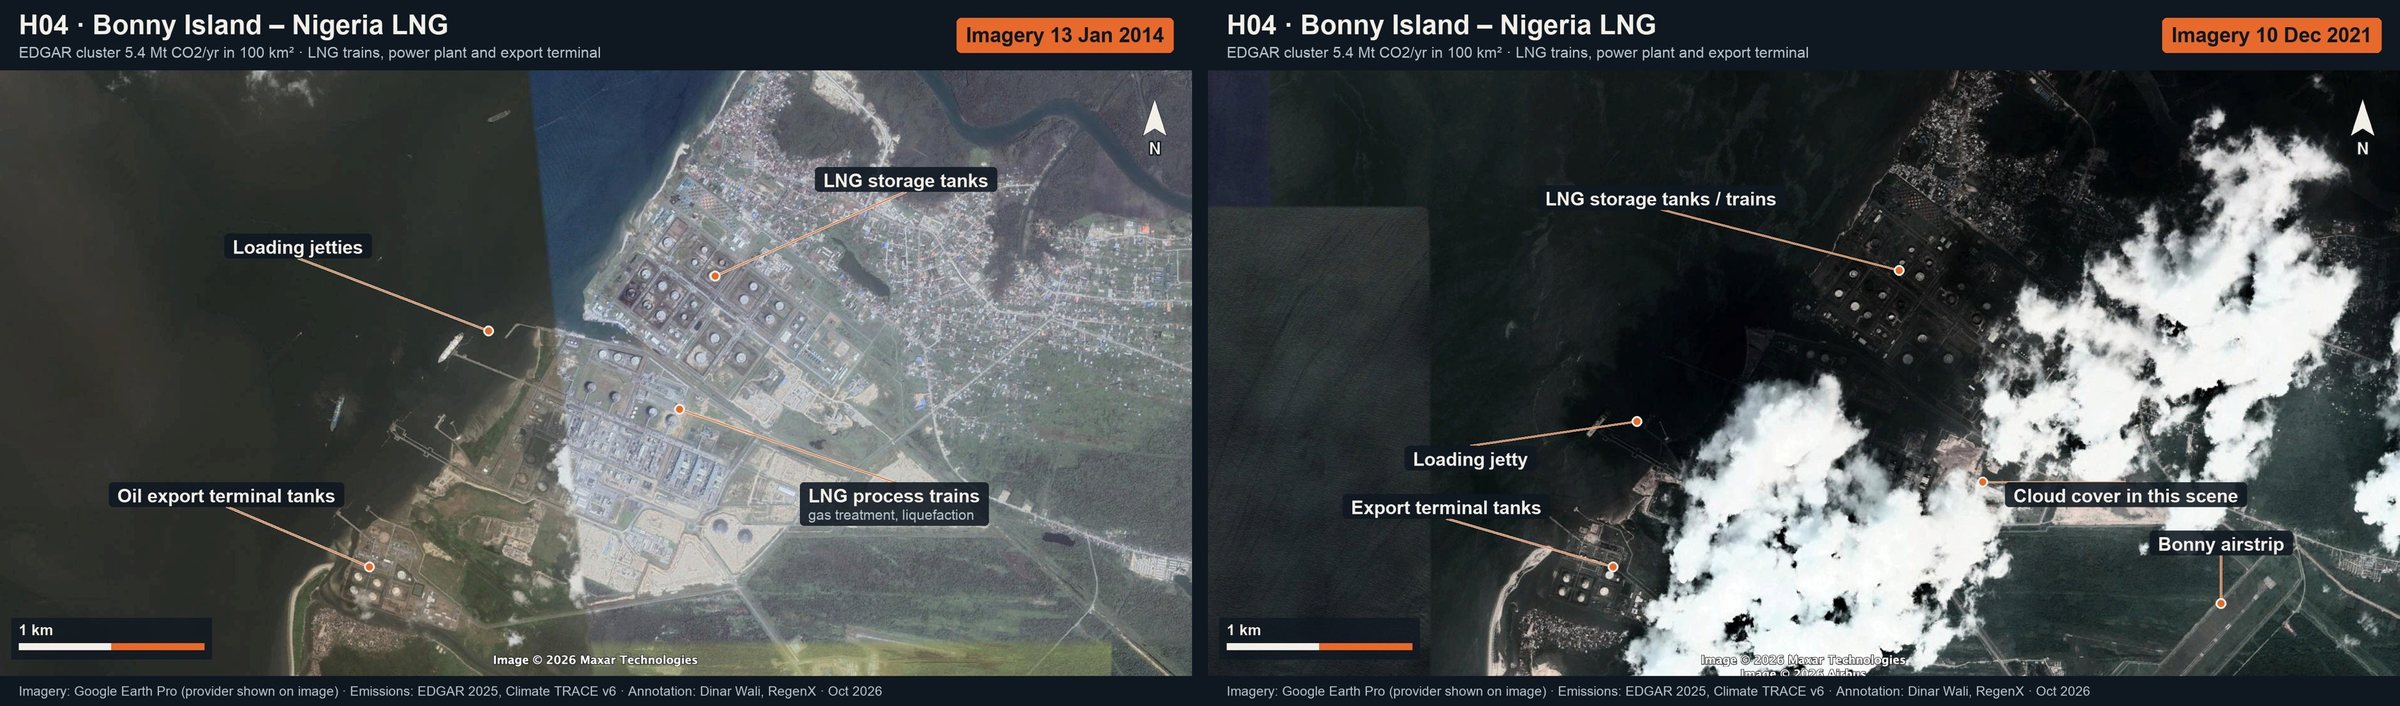
Bonny Island – Nigeria LNG: annotated Google Earth imagery (then and now)
H04 · Bonny Island – Nigeria LNGEDGAR cluster 5.4 Mt CO₂/yr in 100 km² · LNG trains, power plant and export terminalThen and now · full size: Then · Now
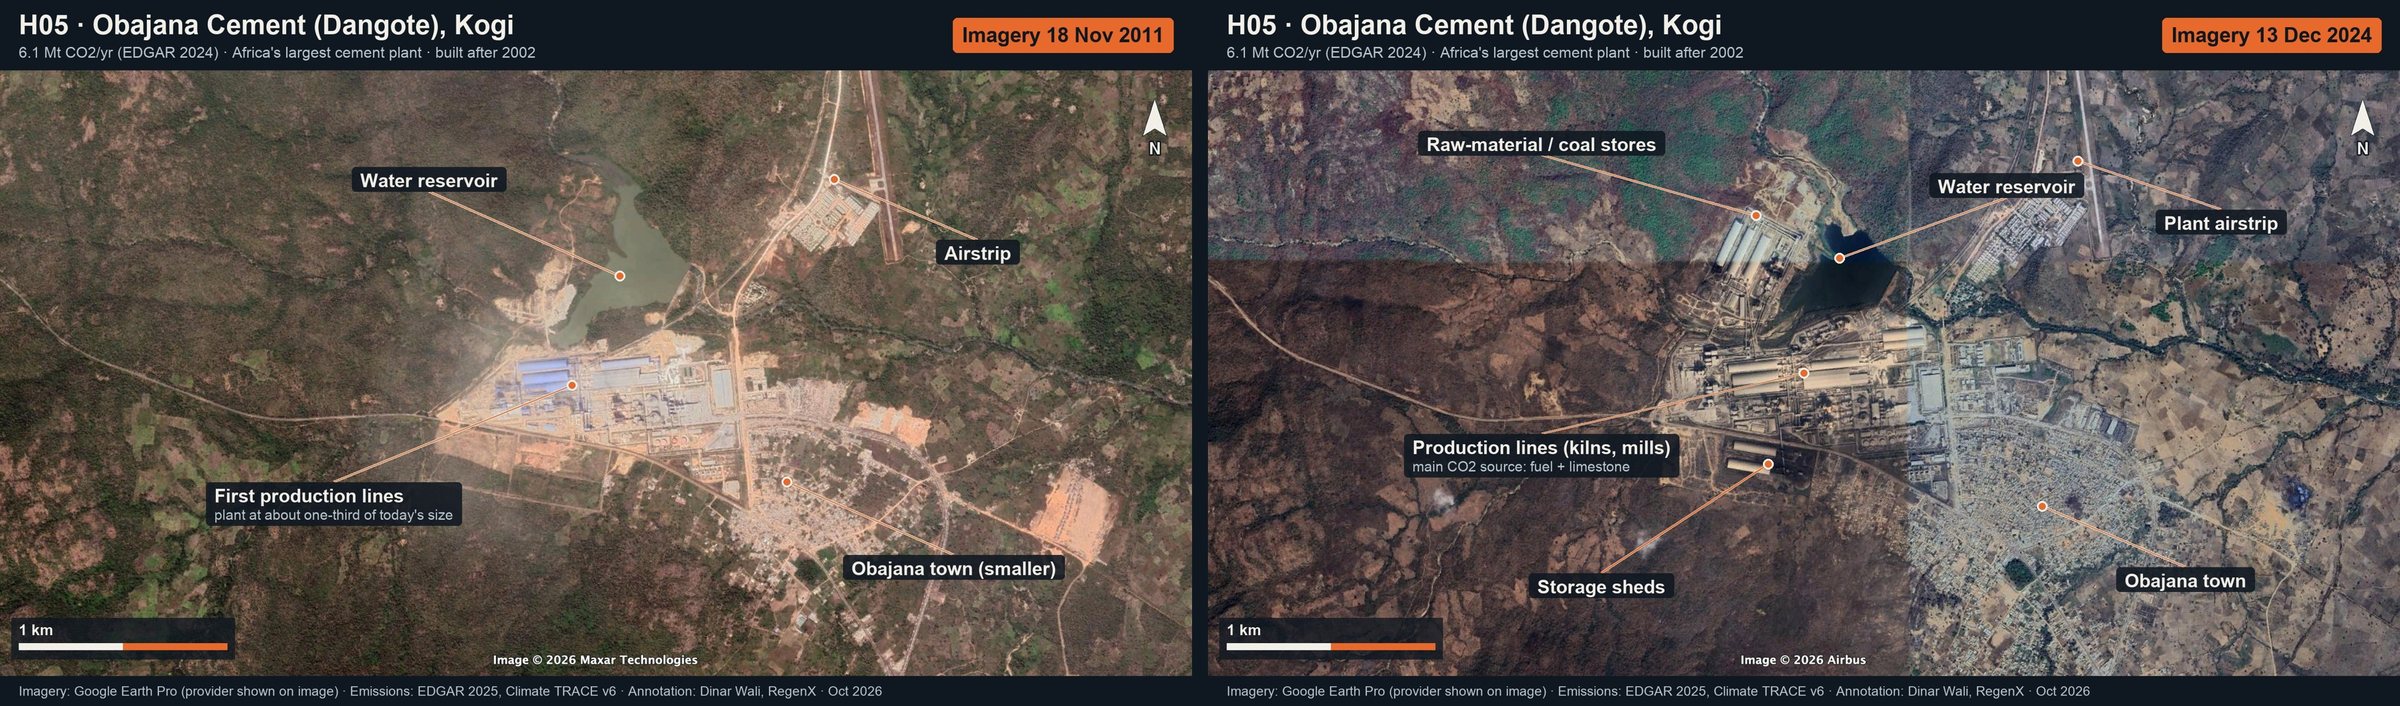
Obajana Cement (Dangote), Kogi: annotated Google Earth imagery (then and now)
H05 · Obajana Cement (Dangote), Kogi6.1 Mt CO₂/yr (EDGAR 2024) · Africa's largest cement plant · built after 2002Then and now · full size: Then · Now
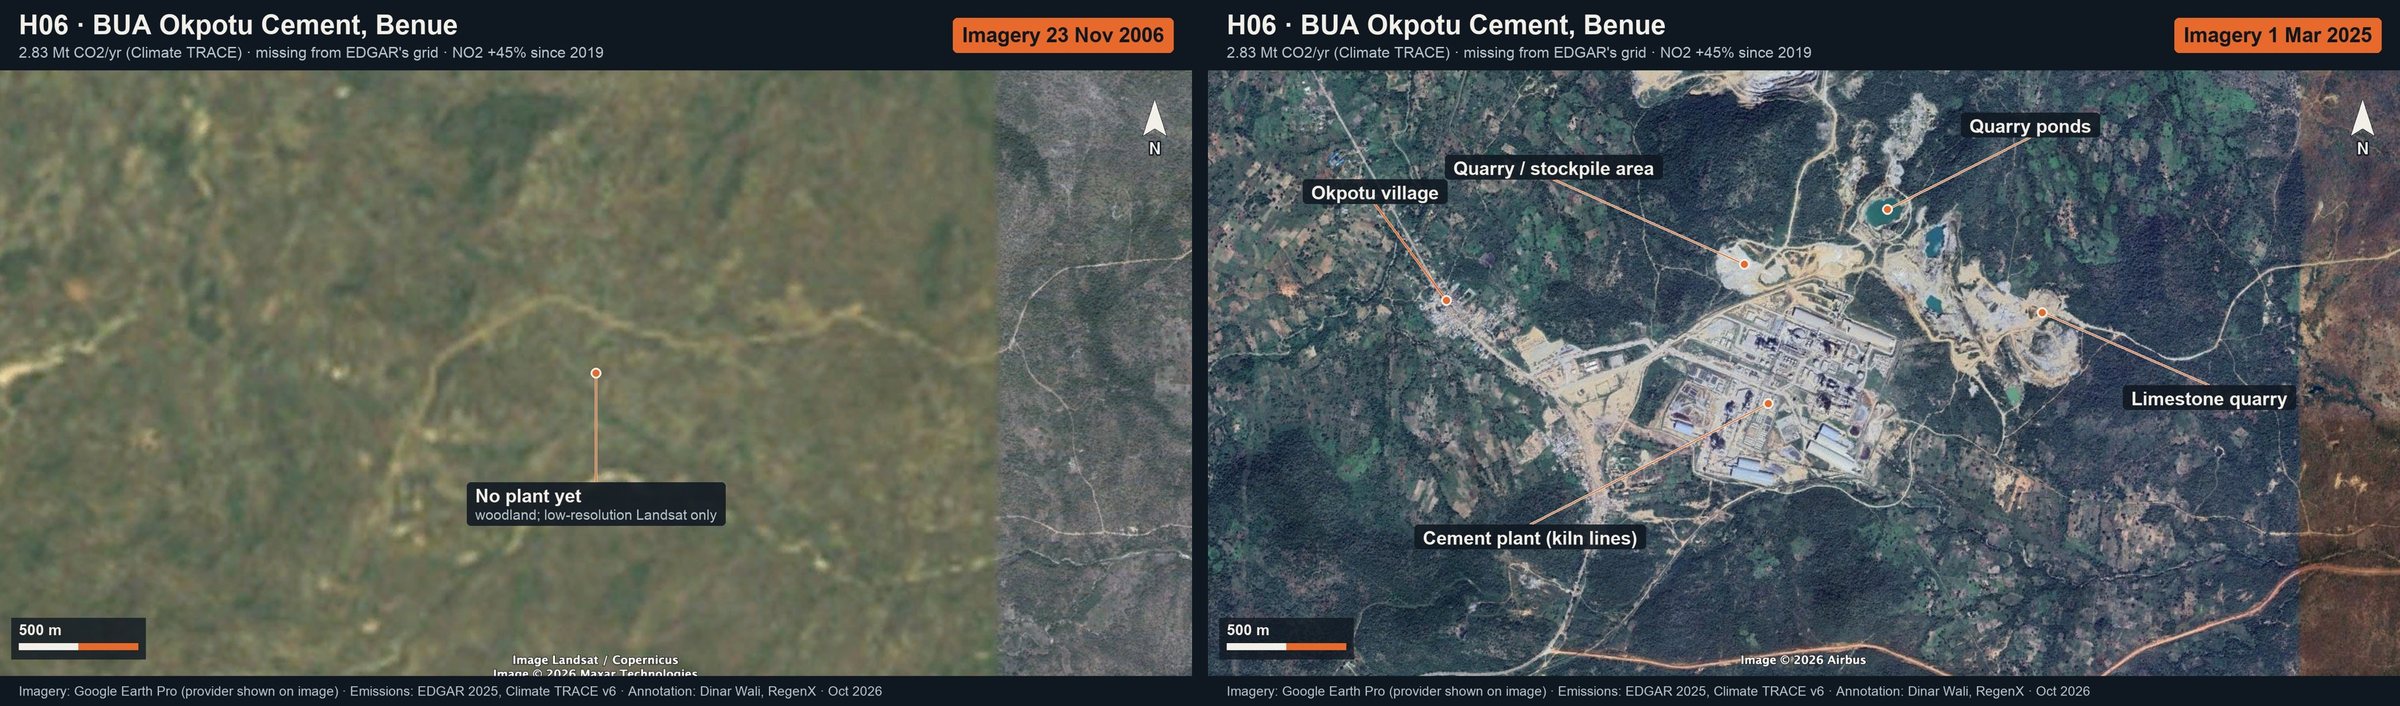
BUA Okpotu Cement, Benue: annotated Google Earth imagery (then and now)
H06 · BUA Okpotu Cement, Benue2.83 Mt CO₂/yr (Climate TRACE) · missing from EDGAR's grid · NO₂ +45% since 2019Then and now · full size: Then · Now
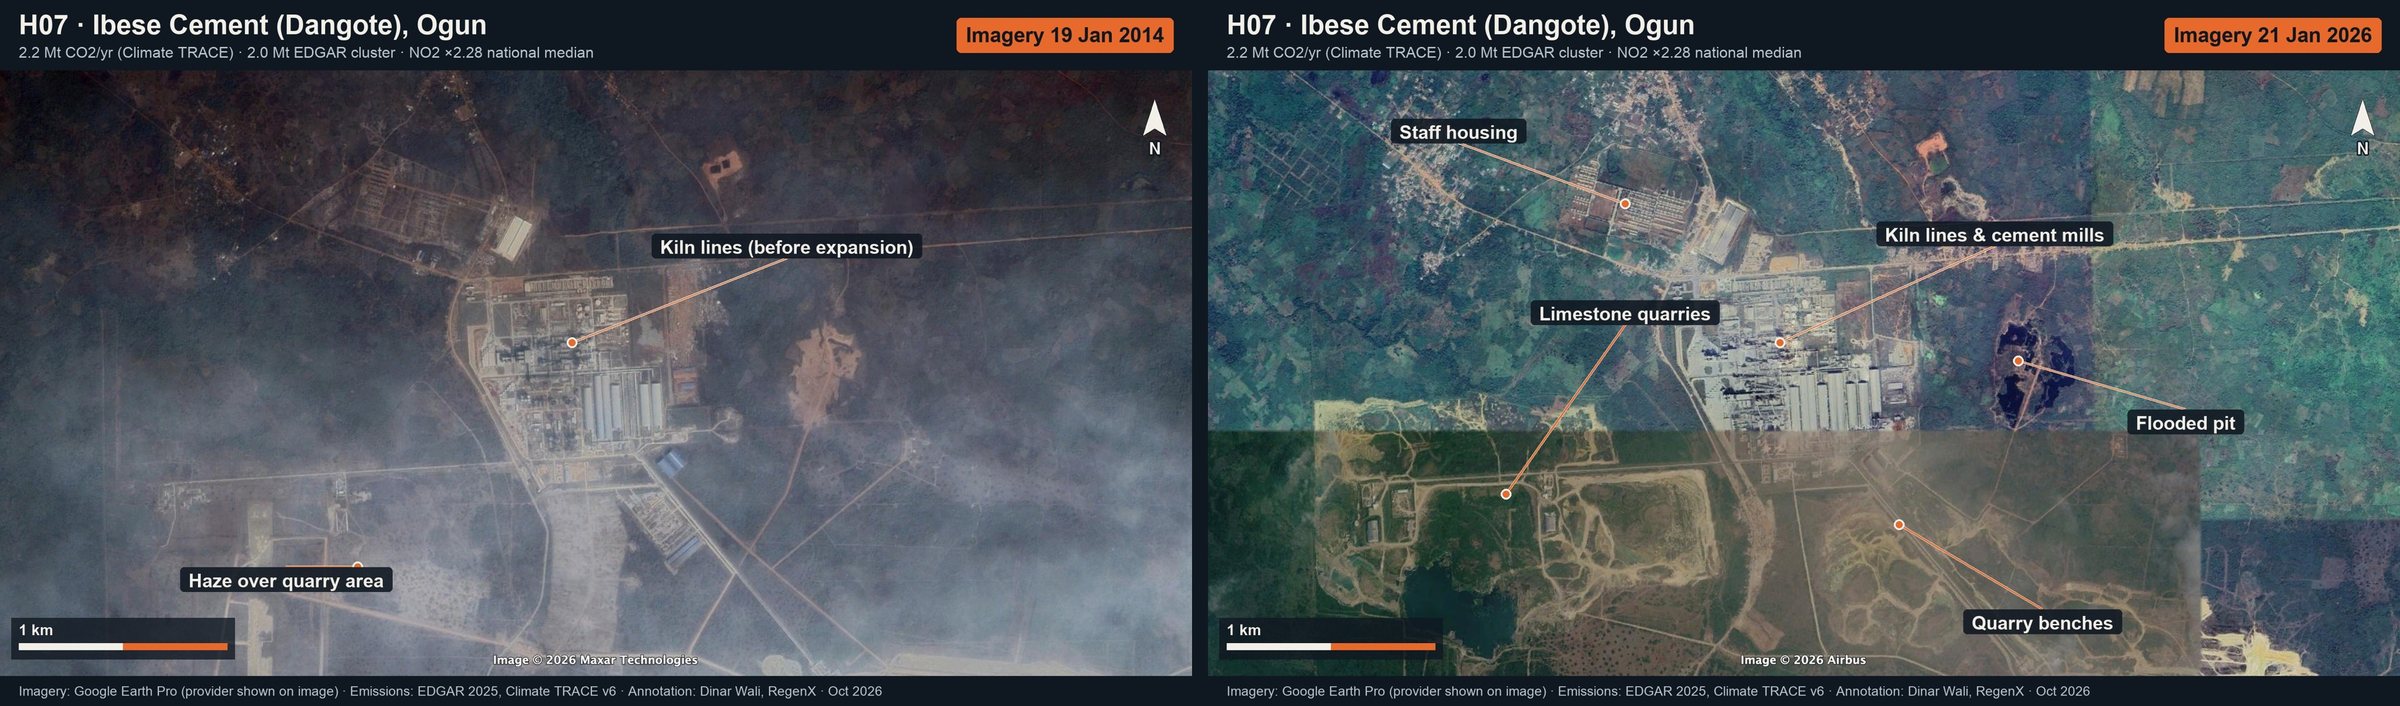
Ibese Cement (Dangote), Ogun: annotated Google Earth imagery (then and now)
H07 · Ibese Cement (Dangote), Ogun2.2 Mt CO₂/yr (Climate TRACE) · 2.0 Mt EDGAR cluster · NO₂ ×2.28 national medianThen and now · full size: Then · Now
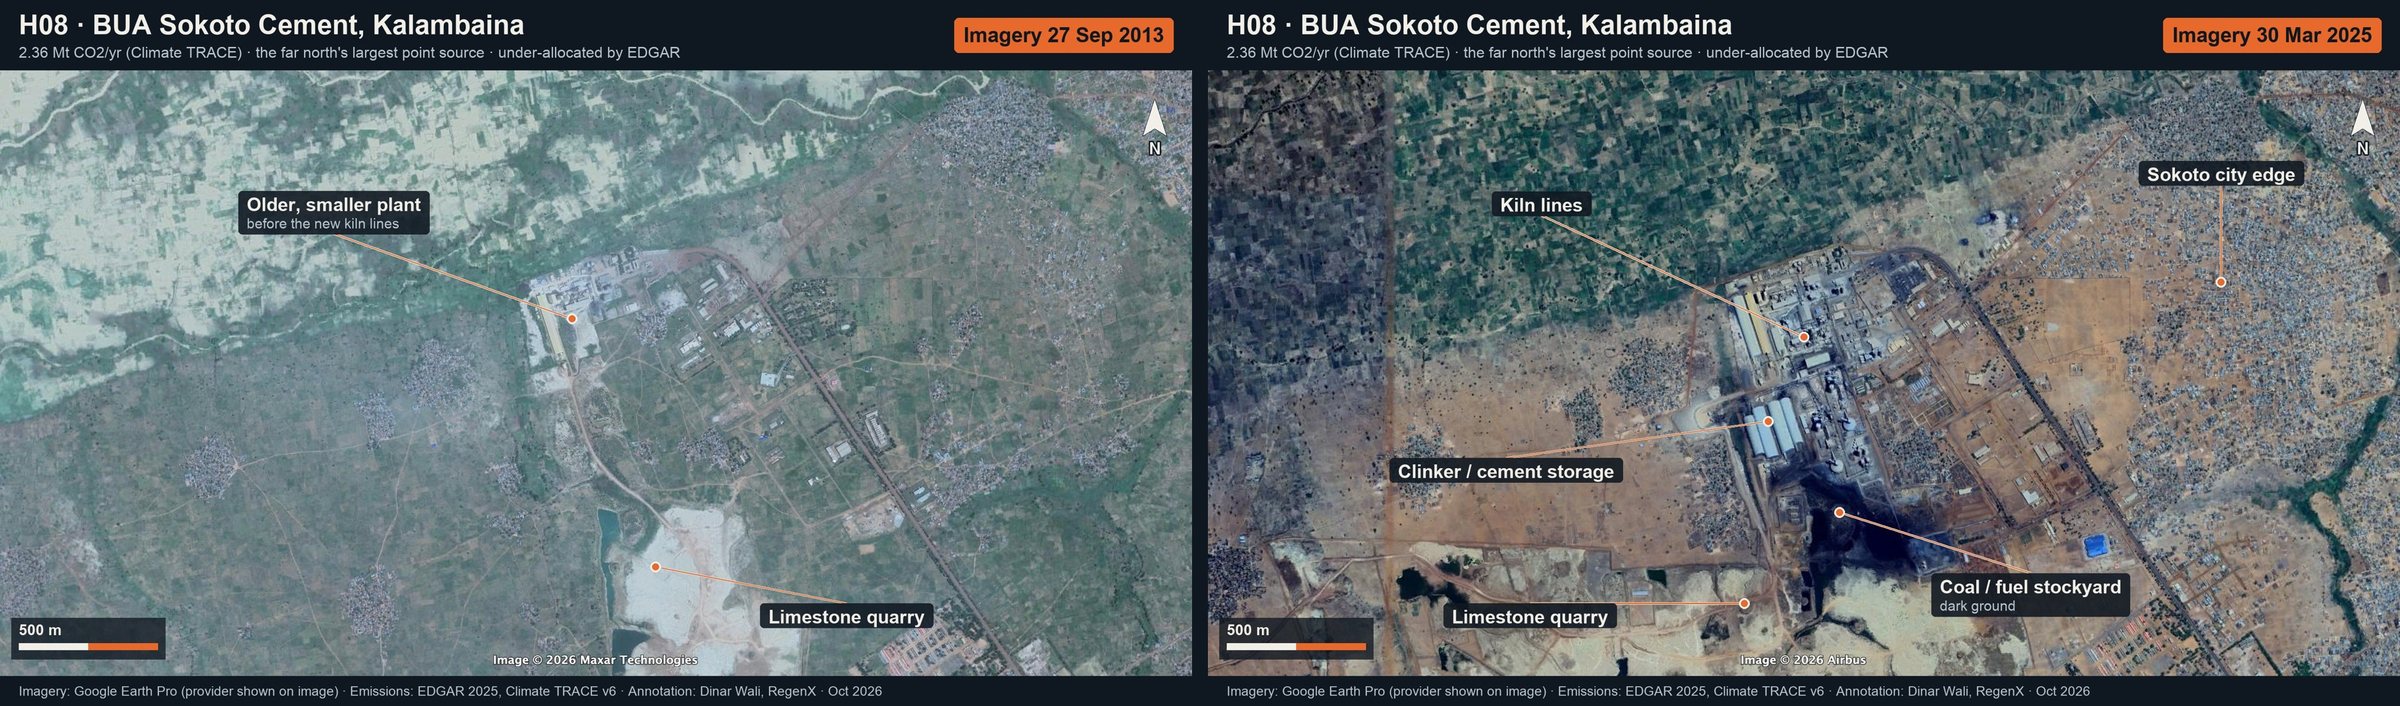
BUA Sokoto Cement, Kalambaina: annotated Google Earth imagery (then and now)
H08 · BUA Sokoto Cement, Kalambaina2.36 Mt CO₂/yr (Climate TRACE) · the far north's largest point source · under-allocated by EDGARThen and now · full size: Then · Now
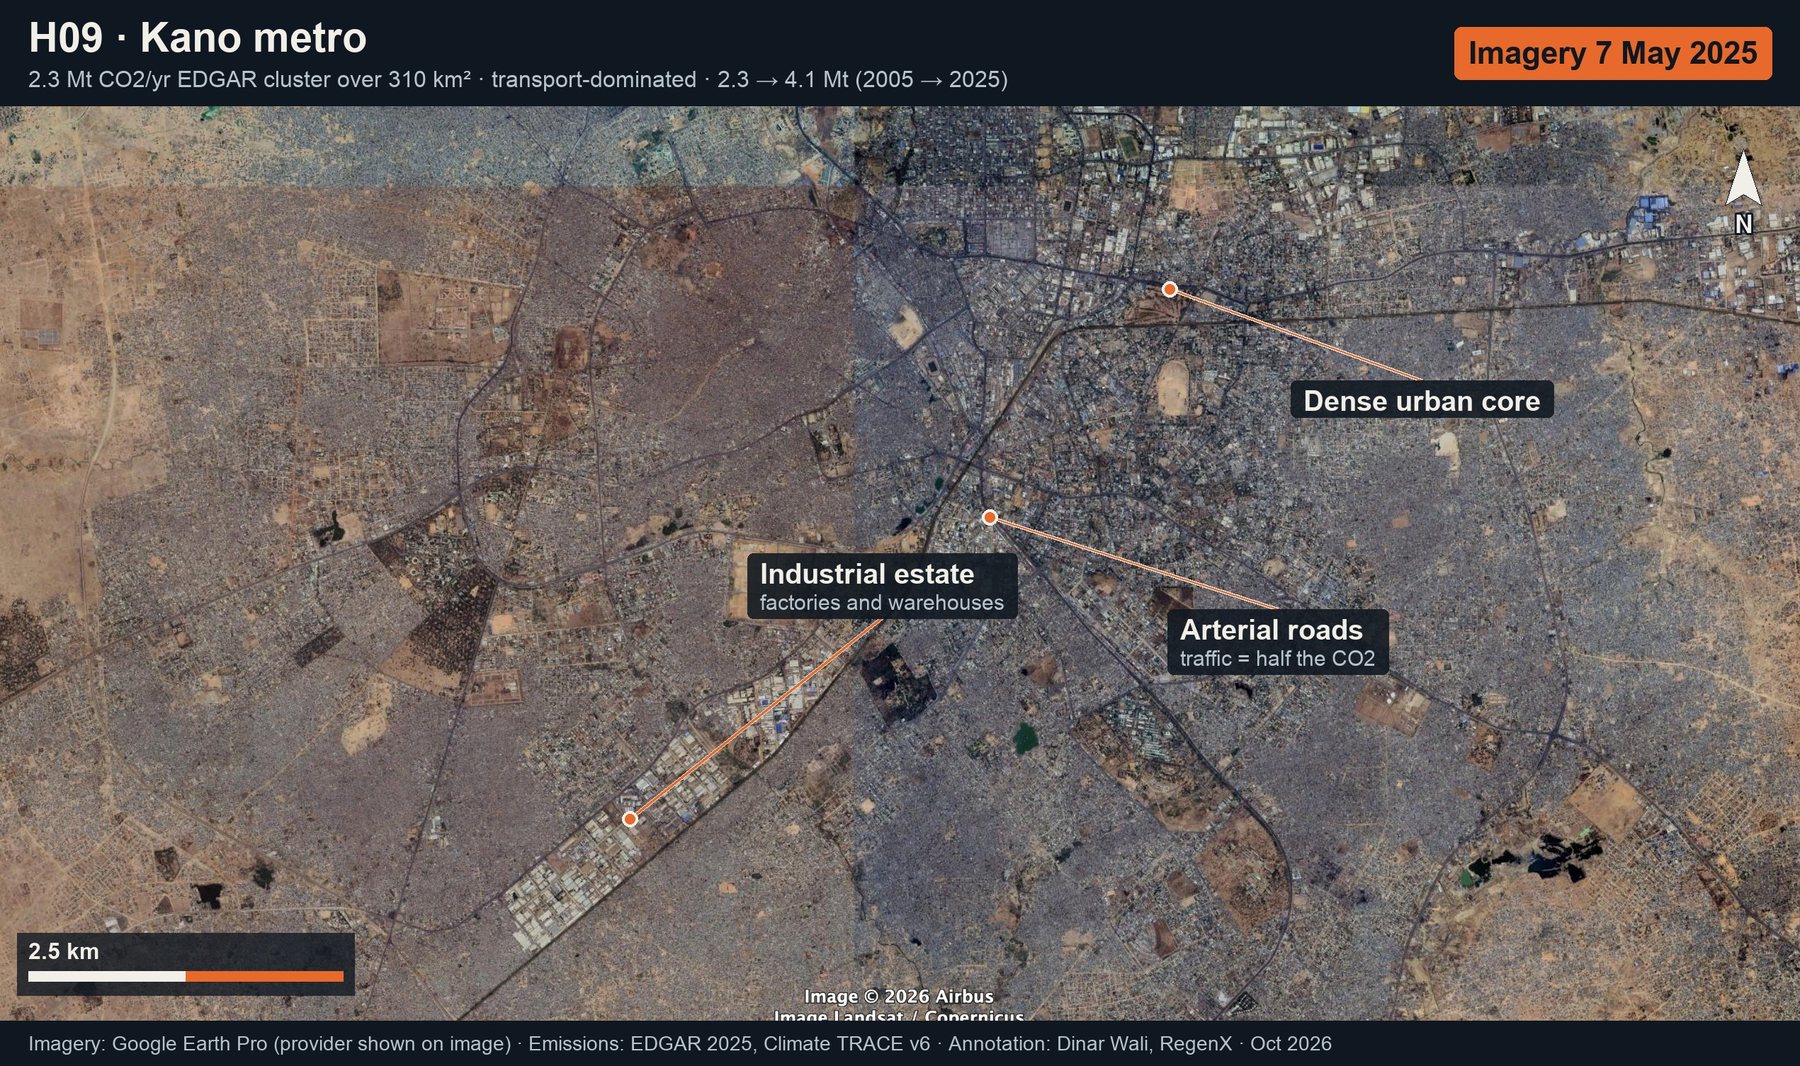
Kano metro: annotated Google Earth imagery (latest only)
H09 · Kano metro2.3 Mt CO₂/yr EDGAR cluster over 310 km² · transport-dominated · 2.3 → 4.1 Mt (2005 → 2025)Latest only · full size: Now
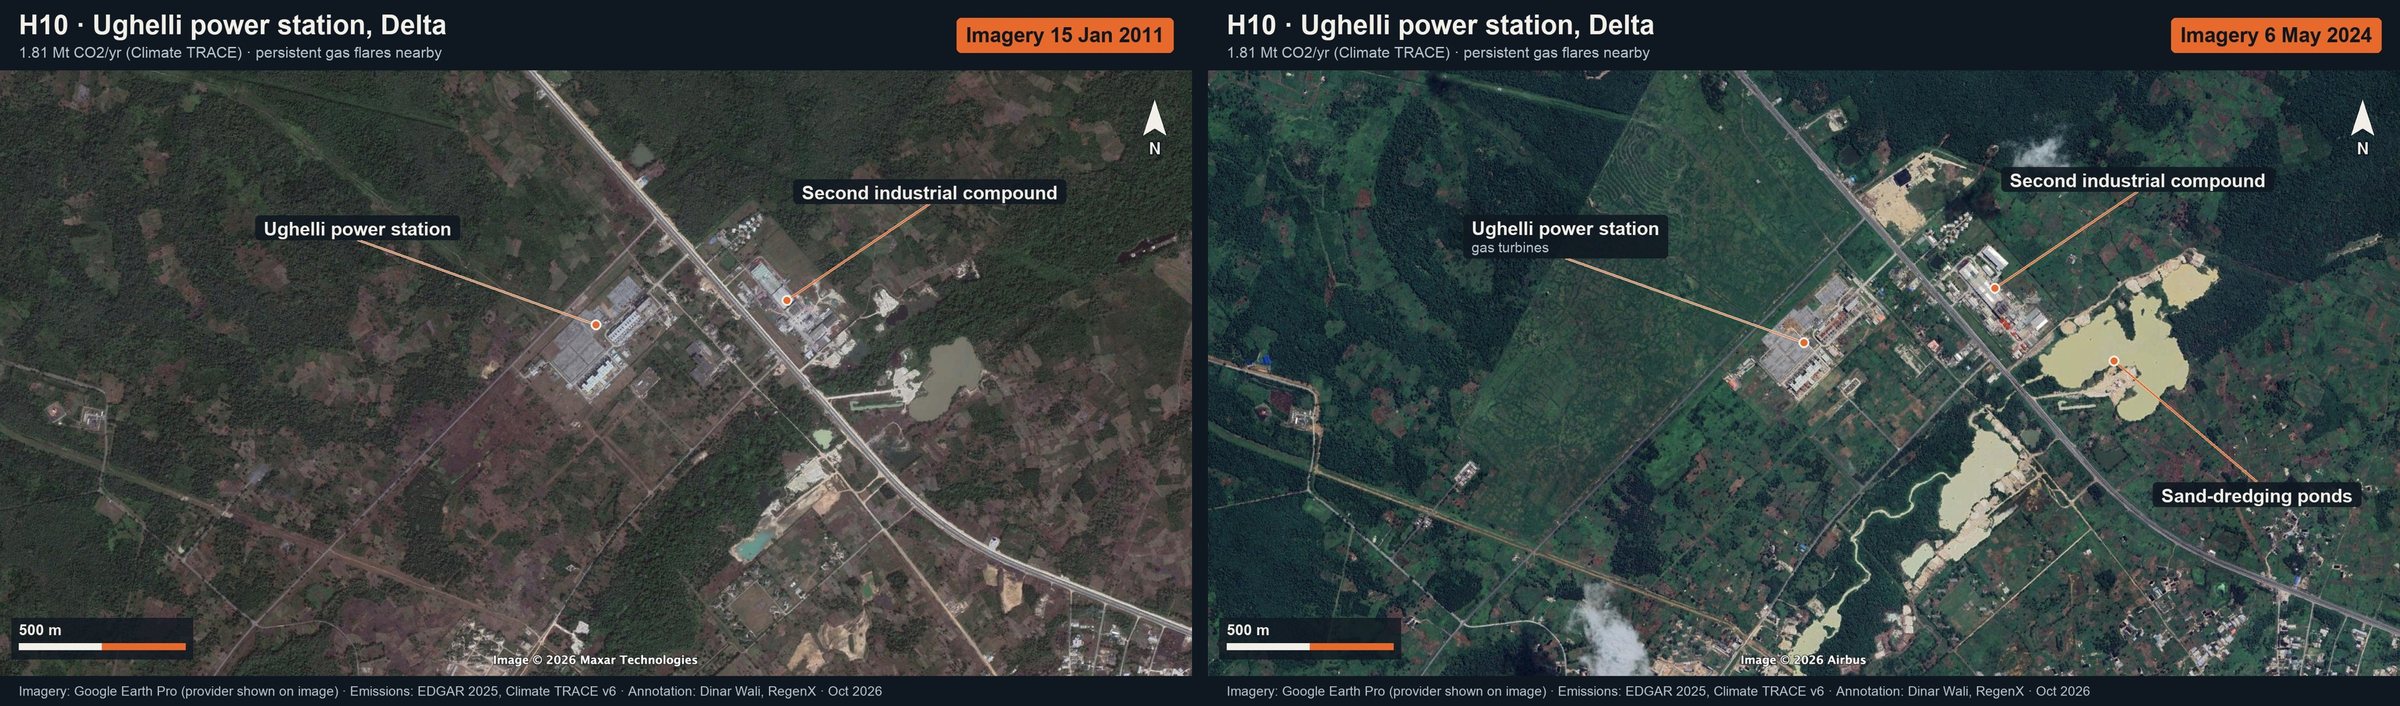
Ughelli power station, Delta: annotated Google Earth imagery (then and now)
H10 · Ughelli power station, Delta1.81 Mt CO₂/yr (Climate TRACE) · persistent gas flares nearbyThen and now · full size: Then · Now
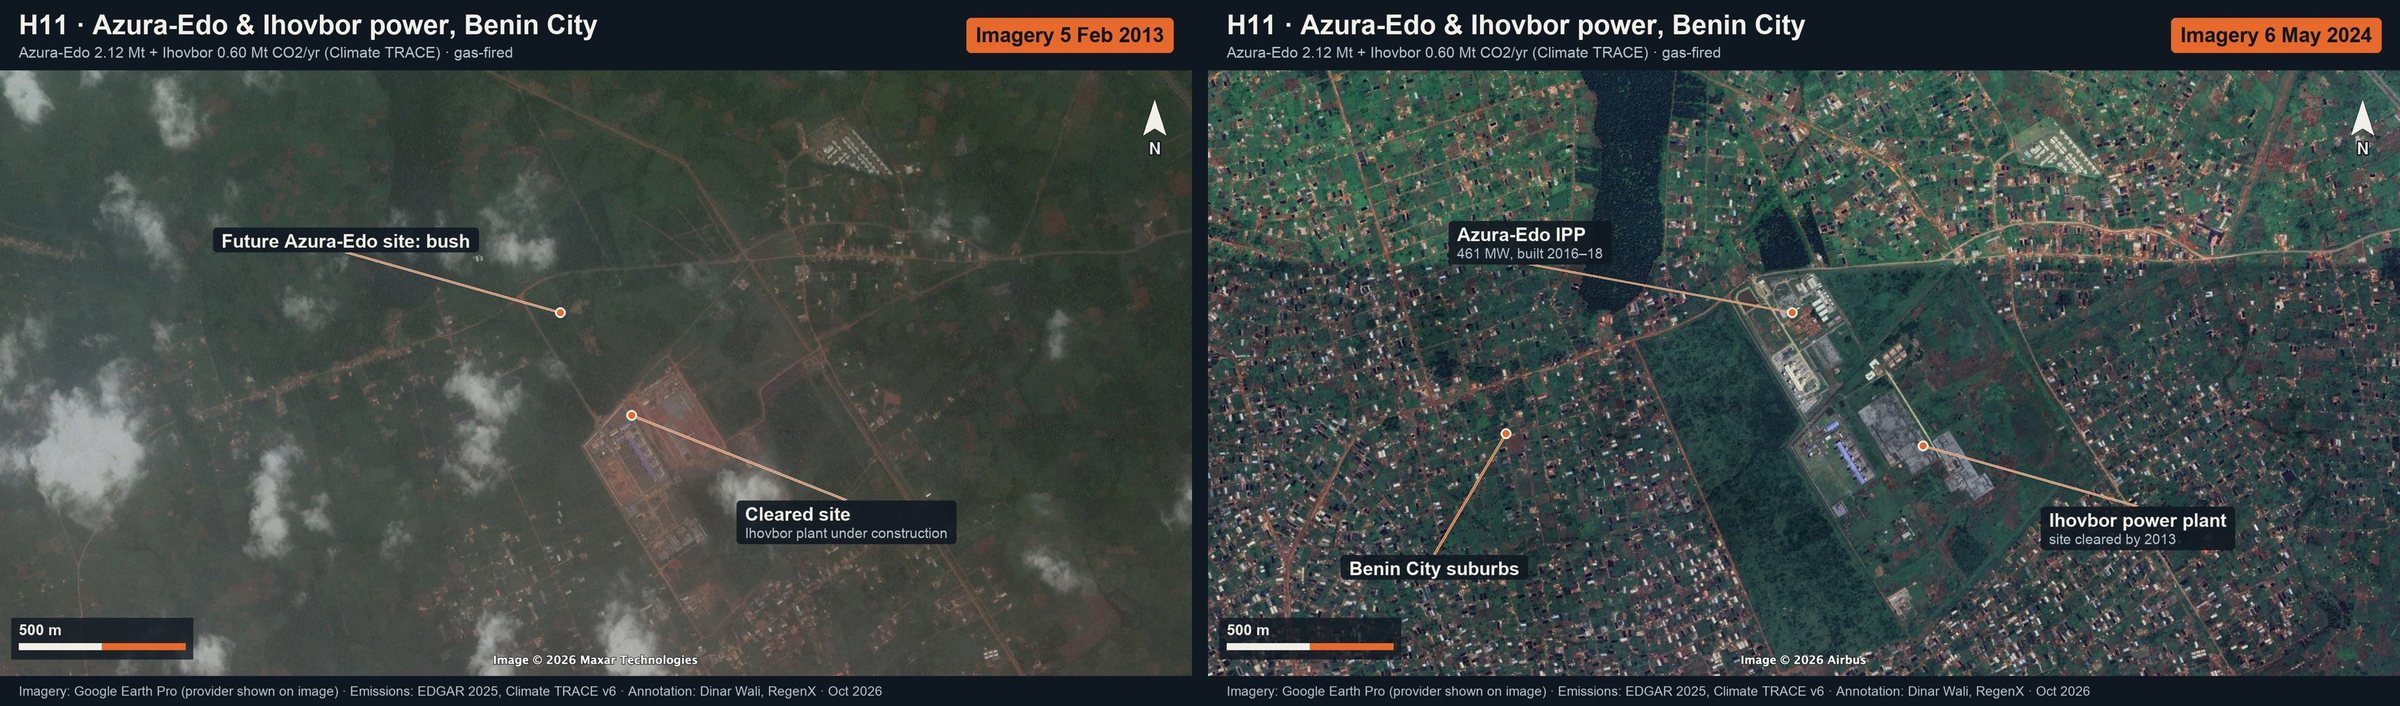
Azura-Edo & Ihovbor power, Benin City: annotated Google Earth imagery (then and now)
H11 · Azura-Edo & Ihovbor power, Benin CityAzura-Edo 2.12 Mt + Ihovbor 0.60 Mt CO₂/yr (Climate TRACE) · gas-firedThen and now · full size: Then · Now
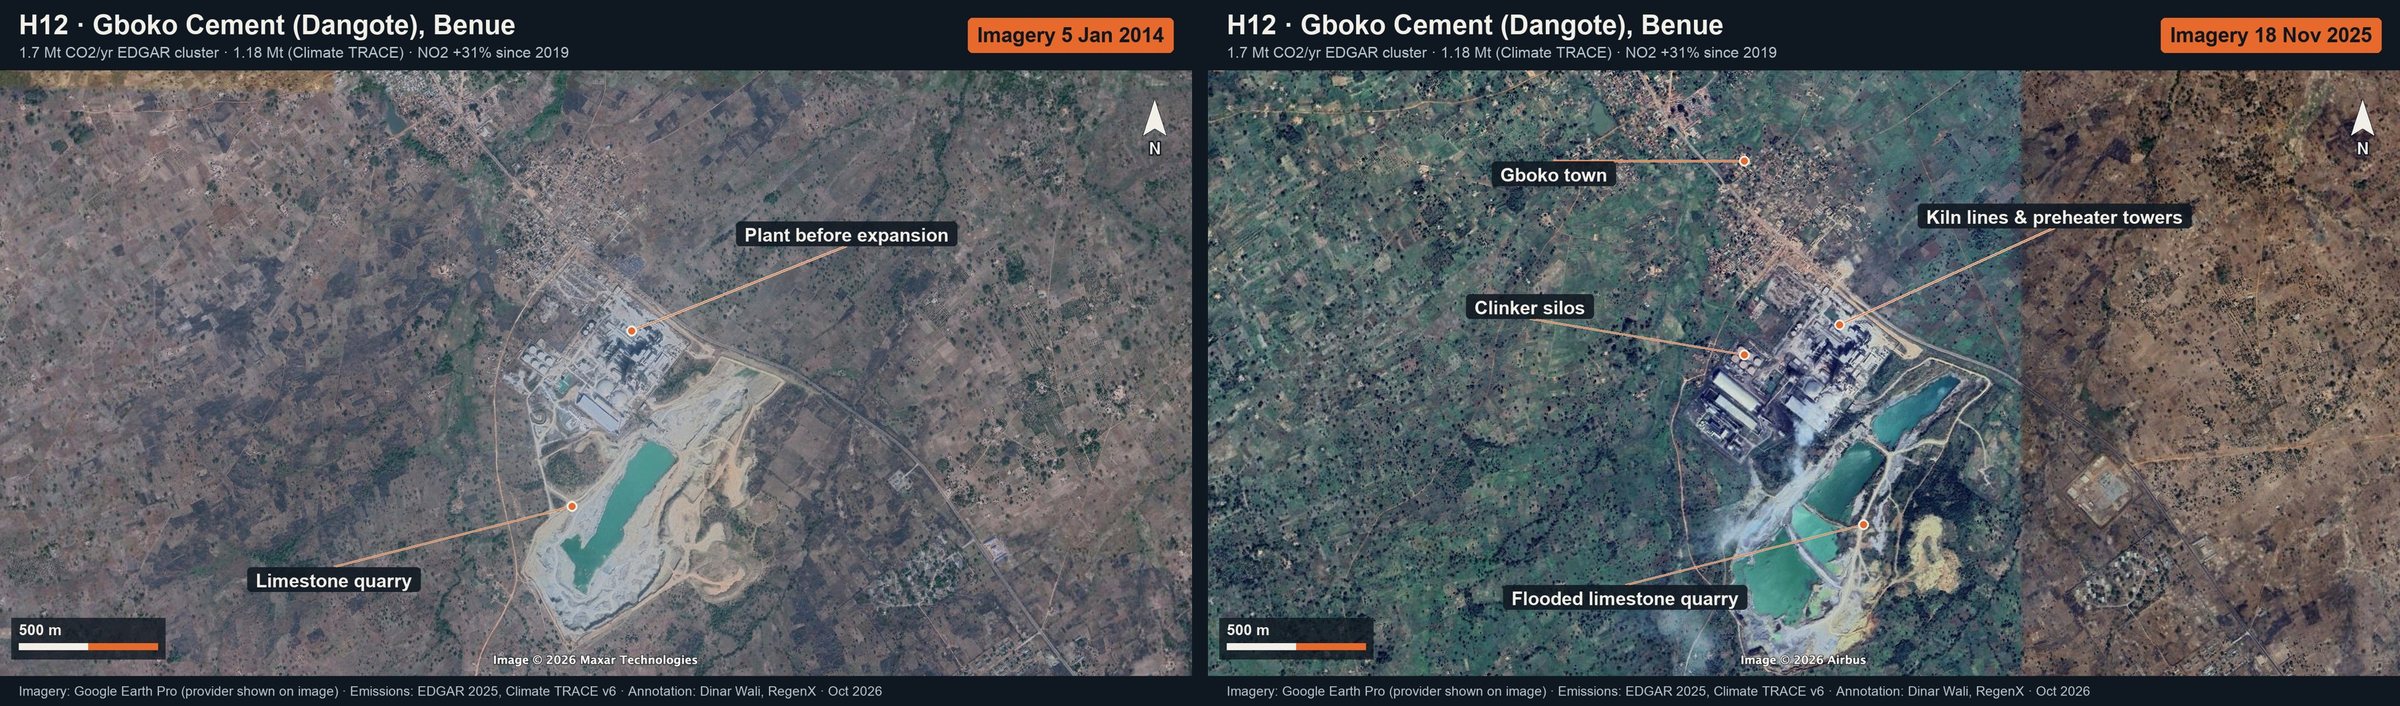
Gboko Cement (Dangote), Benue: annotated Google Earth imagery (then and now)
H12 · Gboko Cement (Dangote), Benue1.7 Mt CO₂/yr EDGAR cluster · 1.18 Mt (Climate TRACE) · NO₂ +31% since 2019Then and now · full size: Then · Now
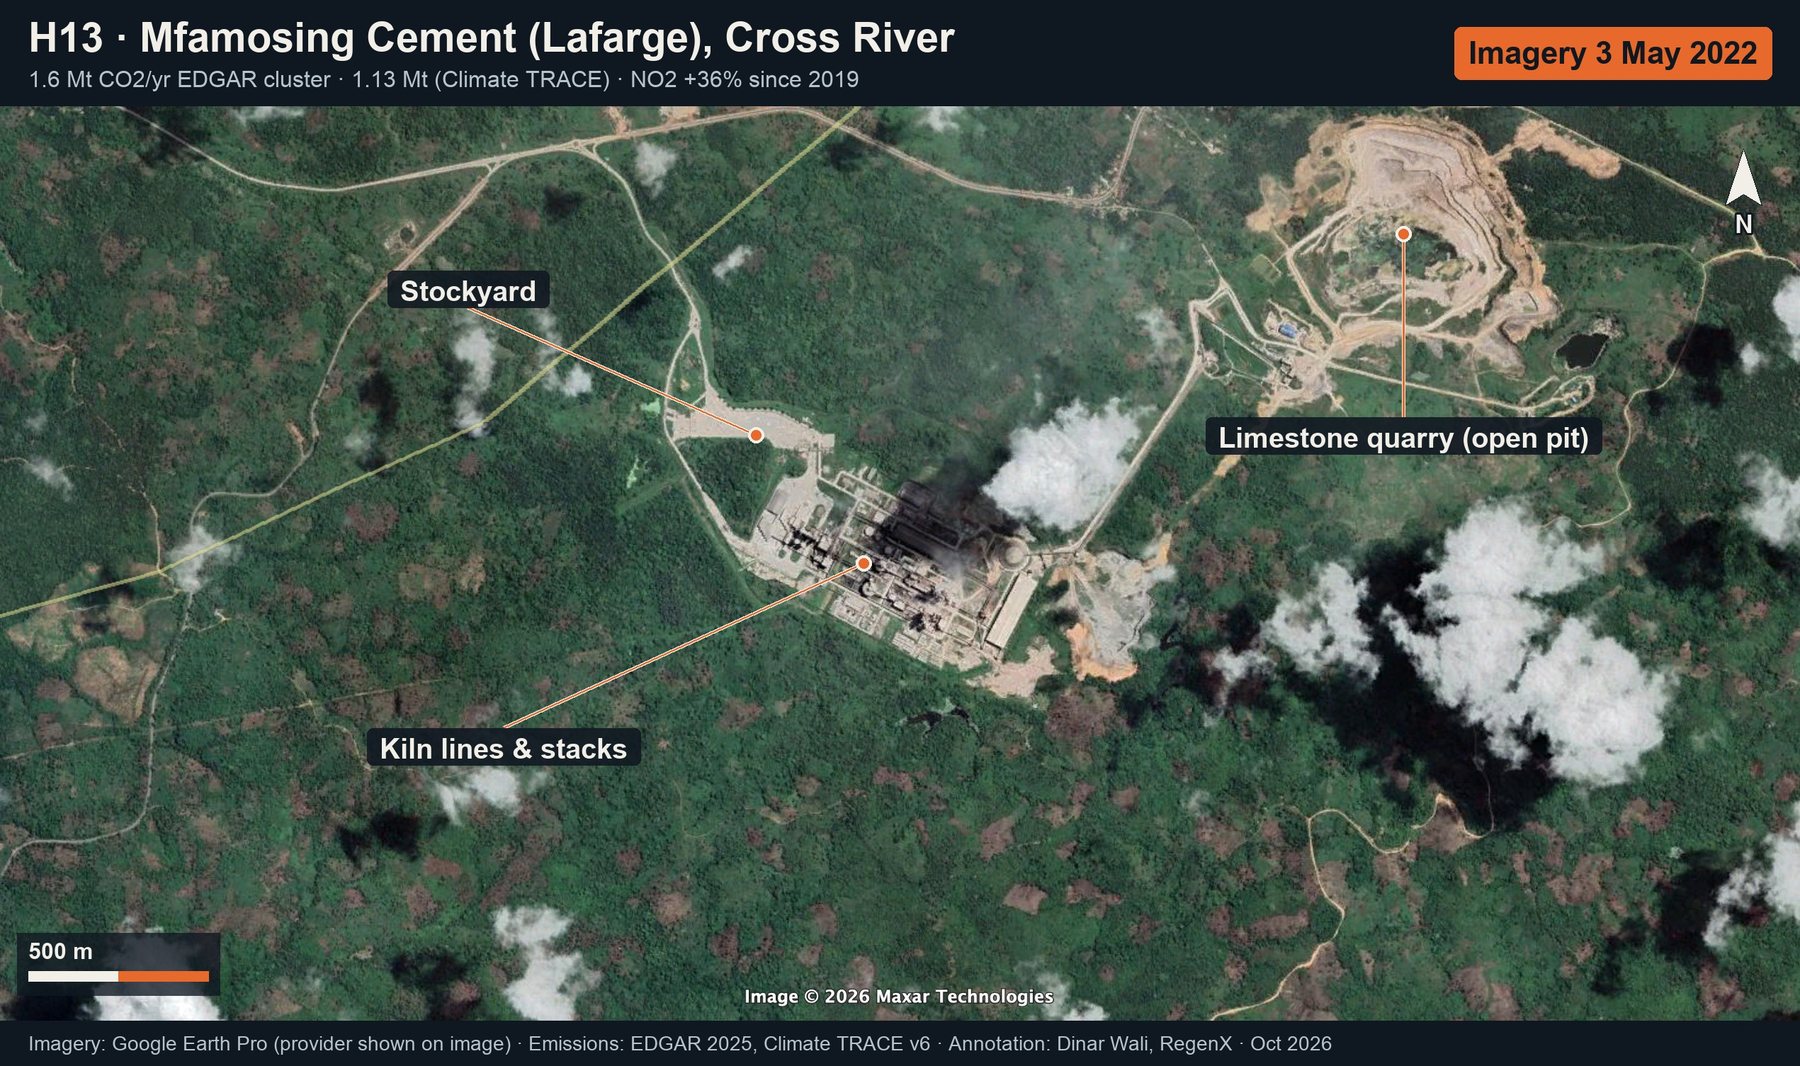
Mfamosing Cement (Lafarge), Cross River: annotated Google Earth imagery (latest only)
H13 · Mfamosing Cement (Lafarge), Cross River1.6 Mt CO₂/yr EDGAR cluster · 1.13 Mt (Climate TRACE) · NO₂ +36% since 2019Latest only · full size: Now
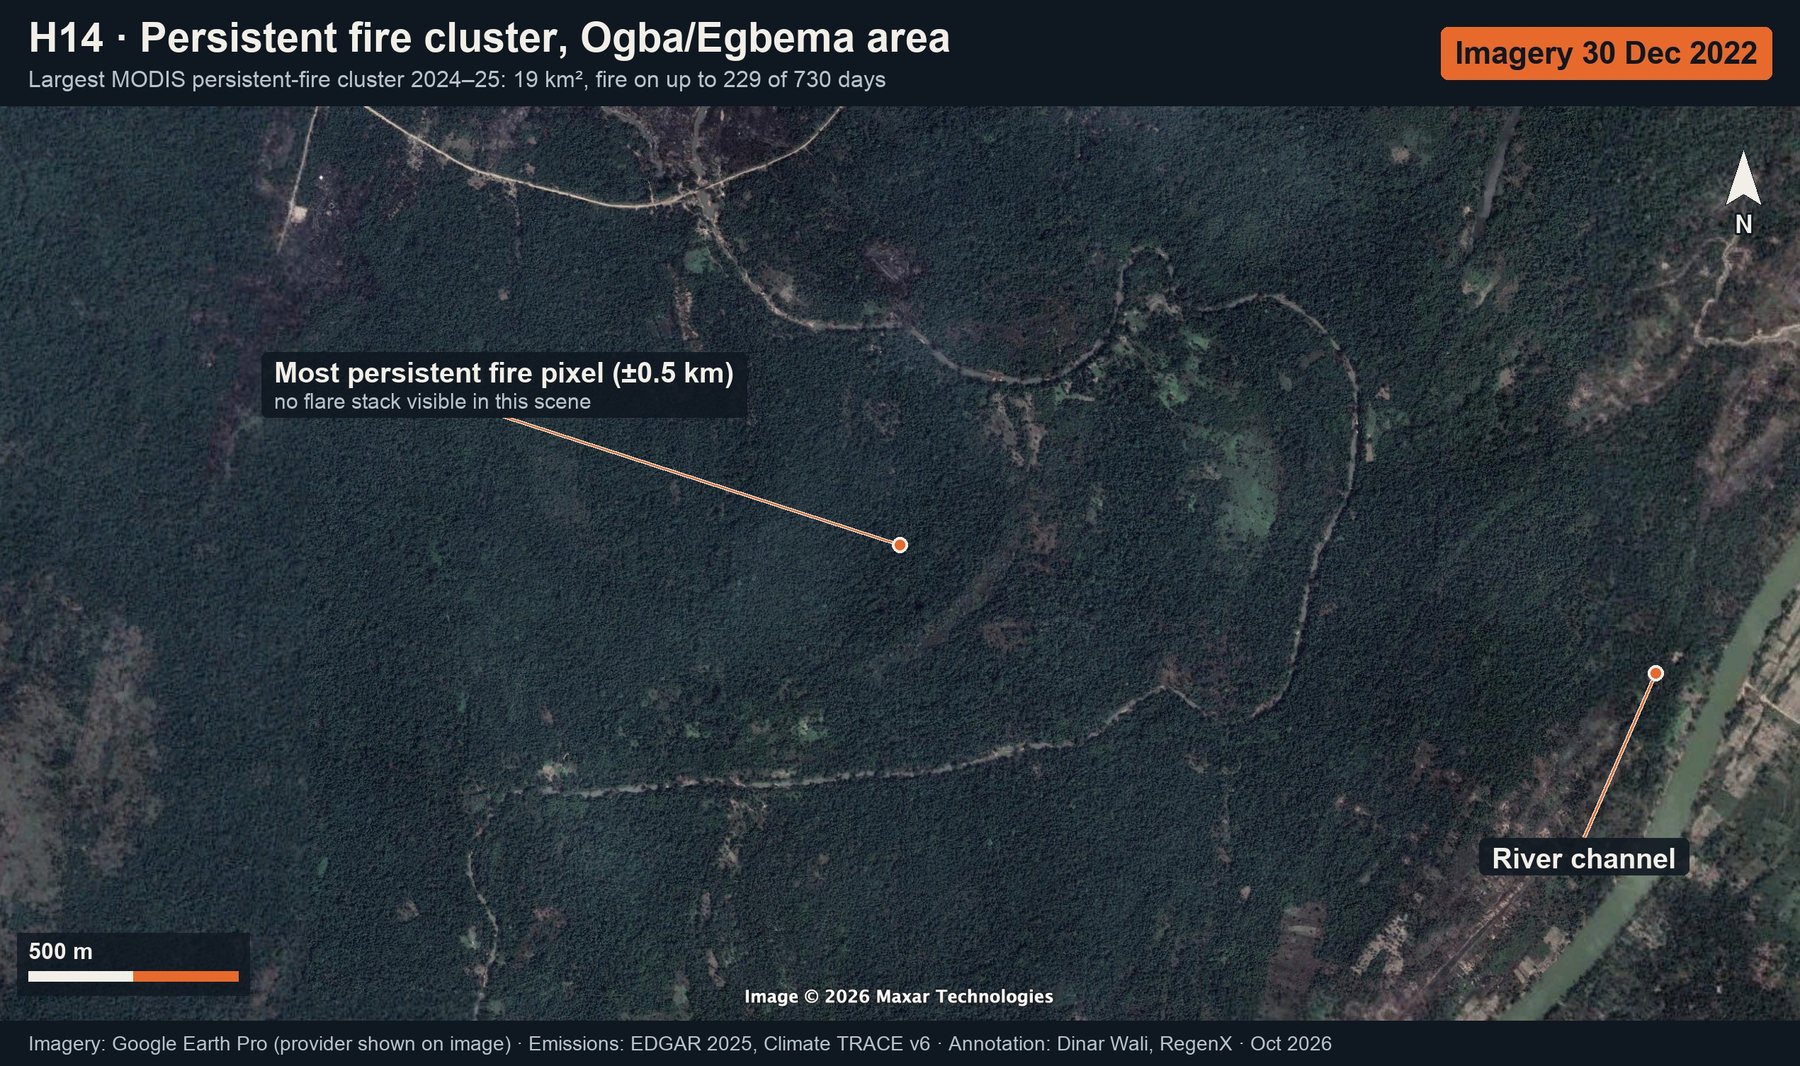
Persistent fire cluster, Ogba/Egbema area: annotated Google Earth imagery (latest only)
H14 · Persistent fire cluster, Ogba/Egbema areaLargest MODIS persistent-fire cluster 2024–25: 19 km², fire on up to 229 of 730 daysLatest only · full size: Now
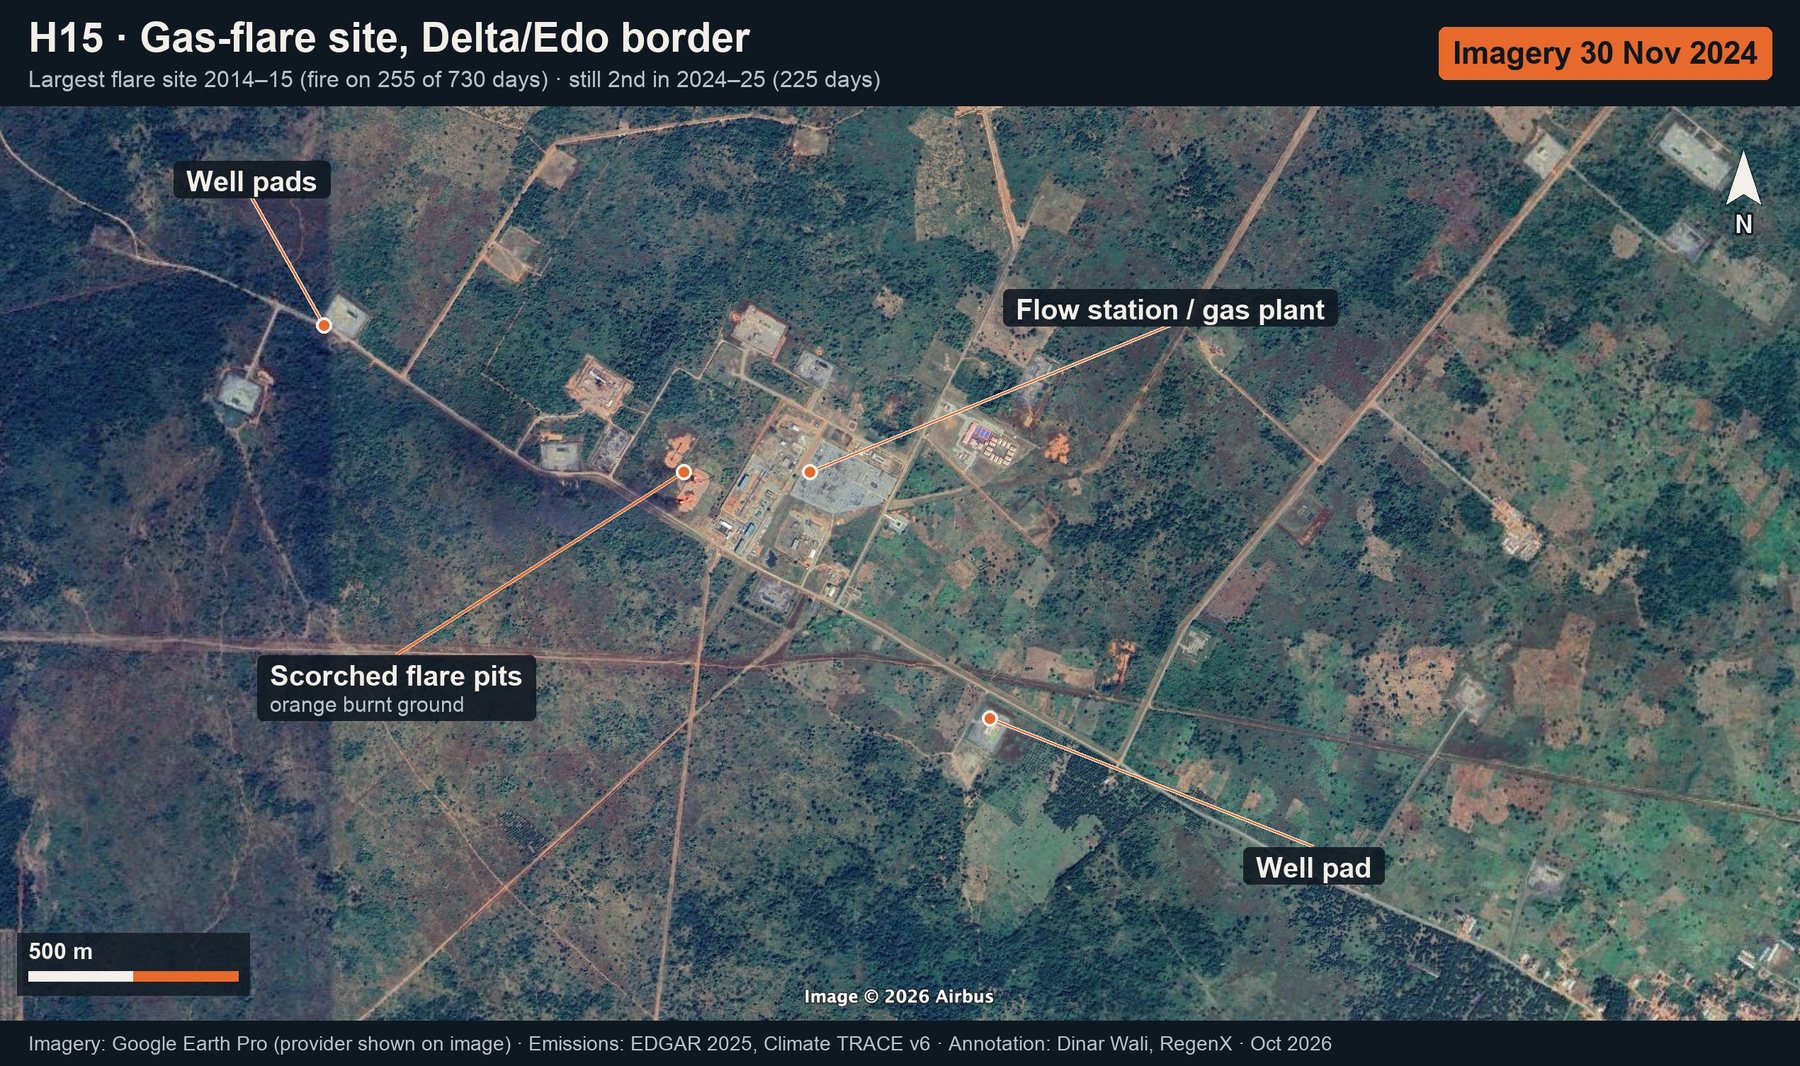
Gas-flare site, Delta/Edo border: annotated Google Earth imagery (latest only)
H15 · Gas-flare site, Delta/Edo borderLargest flare site 2014–15 (fire on 255 of 730 days) · still 2nd in 2024–25 (225 days)Latest only · full size: Now
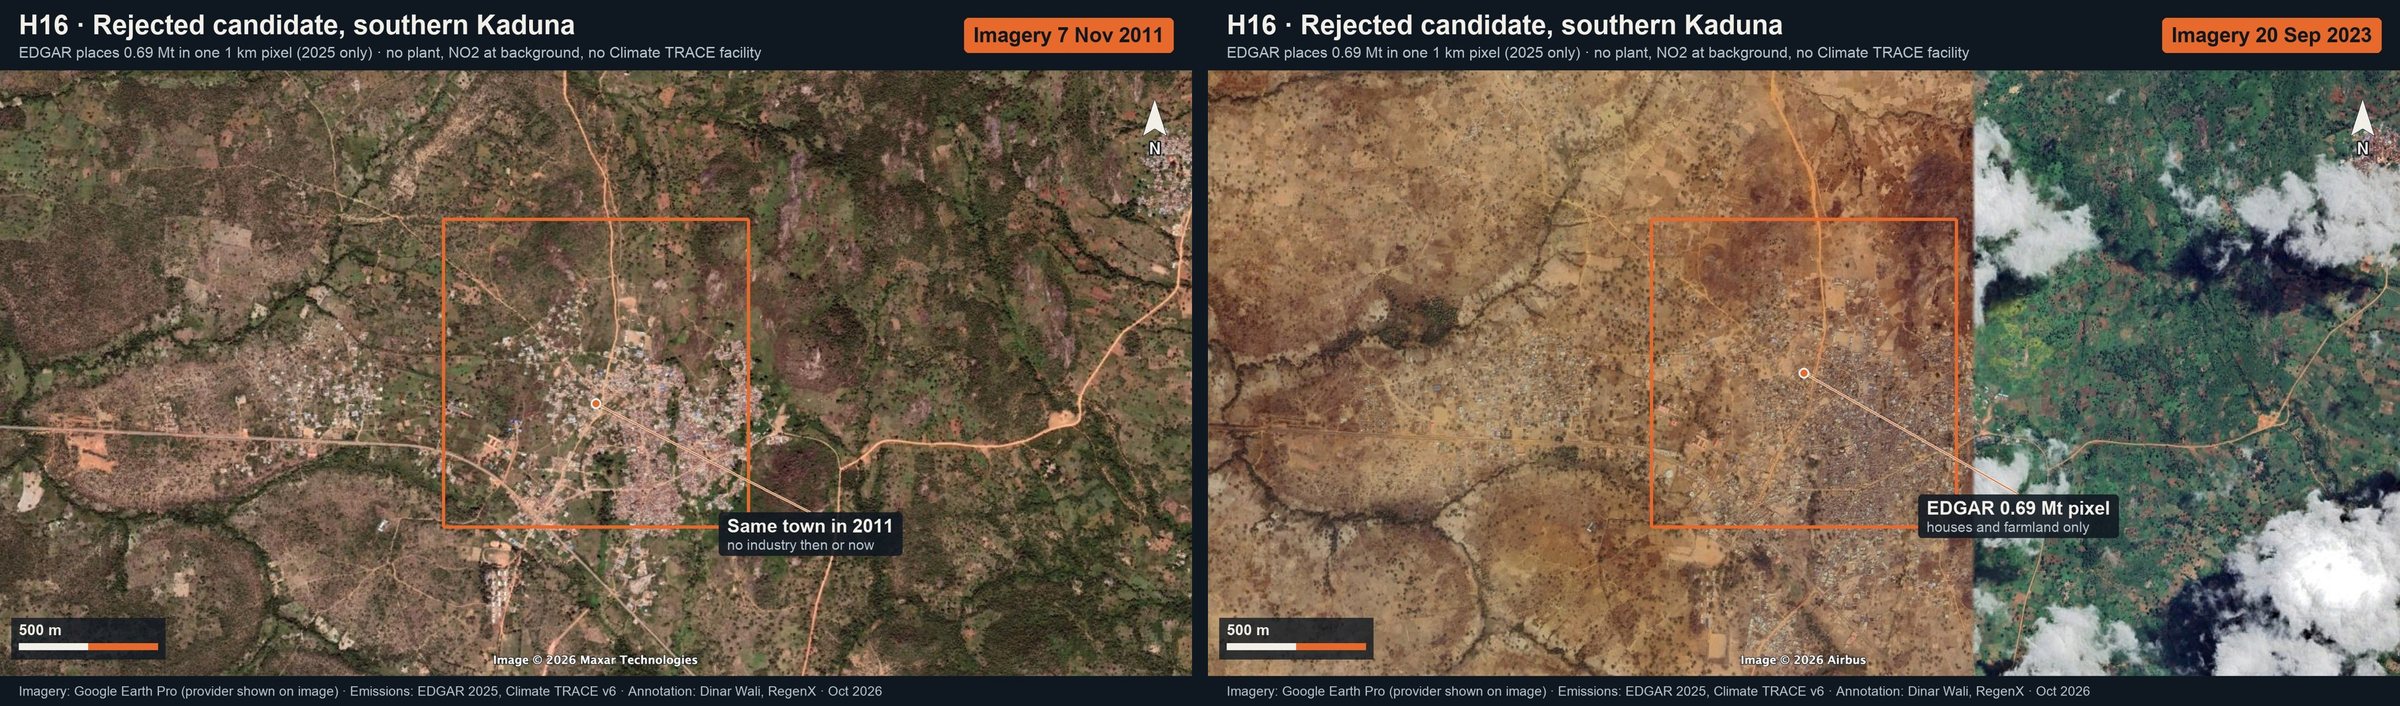
Rejected candidate, southern Kaduna: annotated Google Earth imagery (then and now)
H16 · Rejected candidate, southern KadunaEDGAR places 0.69 Mt in one 1 km pixel (2025 only) · no plant, NO₂ at background, no Climate TRACE facilityThen and now · full size: Then · Now